The social media advertising landscape has changed a lot in the past five years–Facebook Ads included. But what shifted Facebook ad statistics the most in 2021 and 2022, and how should marketers adapt?
This article helps you orient yourself in the new digital-first landscape and decide if Facebook (now meta) is the right marketing channel for you. We list 75 Facebook Ads stats from 2022 and 2021 – only the most up-to-date data.
Need your numbers fast? See the TOP 10 Facebook advertising statistics for 2022 below:
- Facebook has 1.93 billion daily active users (DAU)
- Facebook has 2.91 billion monthly active users (MAU)
- The avg. price per Facebook ad increased by 24% throughout 2021
- 87% of marketers will increase their Facebook ad spend in 2022
- The average Facebook ads CPC in 2022 is around $0.97
- The average Facebook ads CPM in 2022 is around $14
- The average Facebook ads CTR in 2022 is 0.90%
- The average organic reach of a Facebook post is 5.2%
- Facebook’s ad revenue in 2021 was $114.9 billion
- 50.7% of Facebook users are male and 49.3% female
Looking for more? Click on the links below to see all 75 data points and Facebook ads benchmarks:
- Facebook v.s. other ad platforms in 2022
- Facebook ad performance benchmarks
- Facebook audience statistics
- Facebook ad creatives & formats
- Facebook marketing forecasts for 2022 & 2023
- Facebook ad stats from 2020 and earlier
⭐ Facebook v.s. other ad platforms in 2022
Facebook is the largest social media network by user numbers in the world. These stats give a clearer picture of where Facebook gets its edge over other platforms.
Keep in mind that Instagram and Messenger are also part of the Facebook ad network, along with tens of thousands of websites and mobile apps reachable by advertising in the Facebook Audience Network.
1. Facebook has the most social media users in 2022
According to Meta’s investor report, the platform (including Facebook, Instagram, WhatsApp, and Messenger) had (3.59B) monthly active users in December 2021.
However, the January 2022 social media MAU (monthly active user) statistics by Statista show that Facebook had 2.91 MAU, followed by YouTube (2.56 billion) and WhatsApp (2.0 billion users).
TikTok, at 1 billion MAUs, has yet a lot of catching up to do.
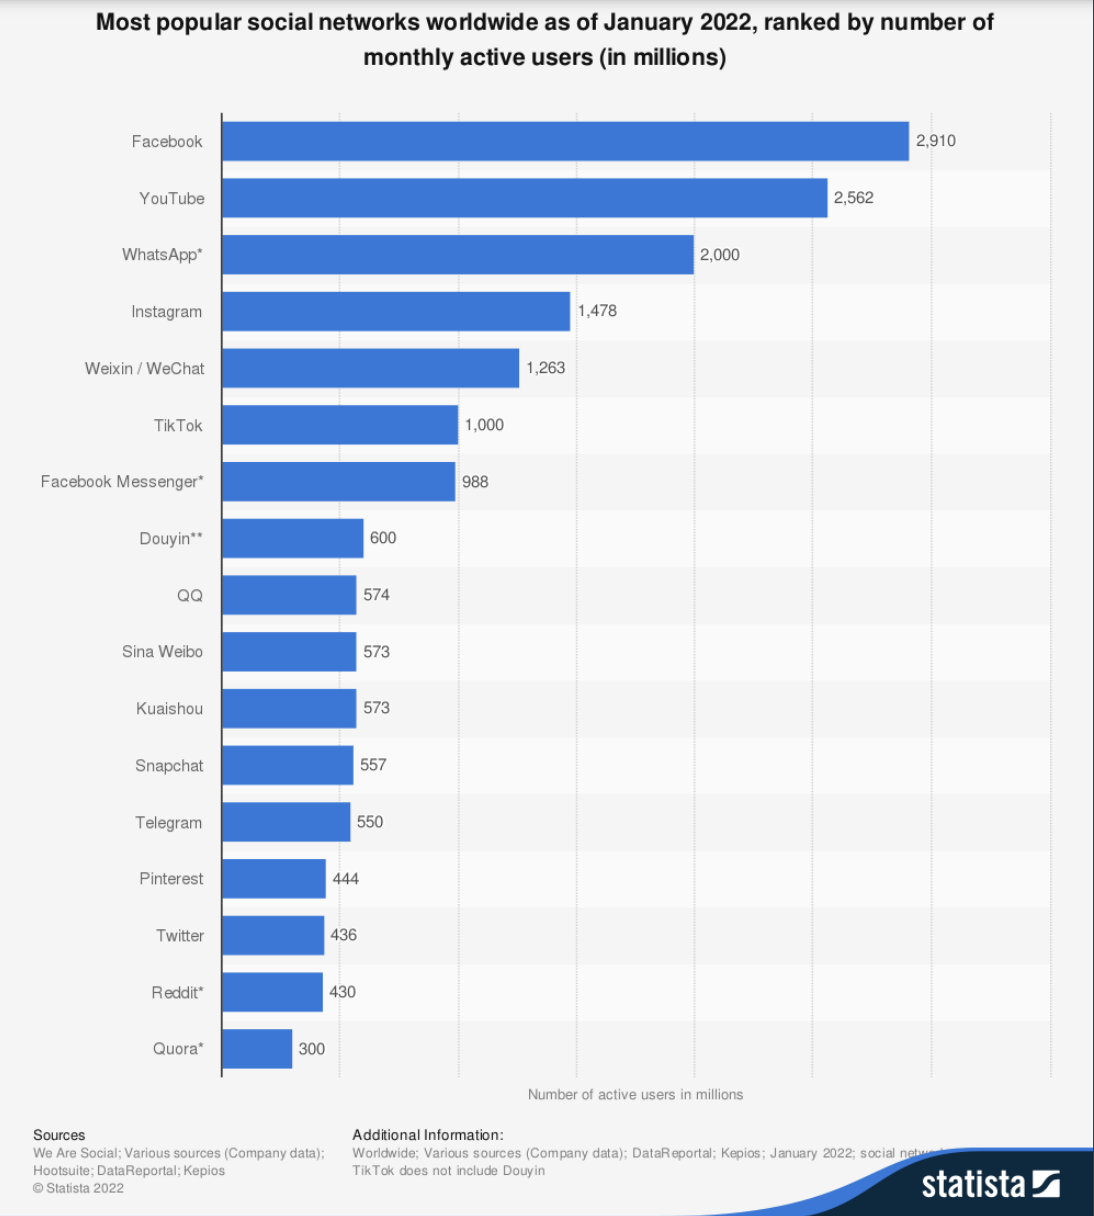
Facebook has 2.9 billion monthly active users in 2022 – Source
2. 98% of marketers will invest in Facebook ads in 2022
When asked about their preferred social advertising channels in 2022, most marketers answered Facebook (98%), Instagram (94%), and YouTube (88%).
The other social ad channels are still far behind. If you’re working with low budgets and limited resources, we recommend investing in these TOP 3 platforms as a priority.
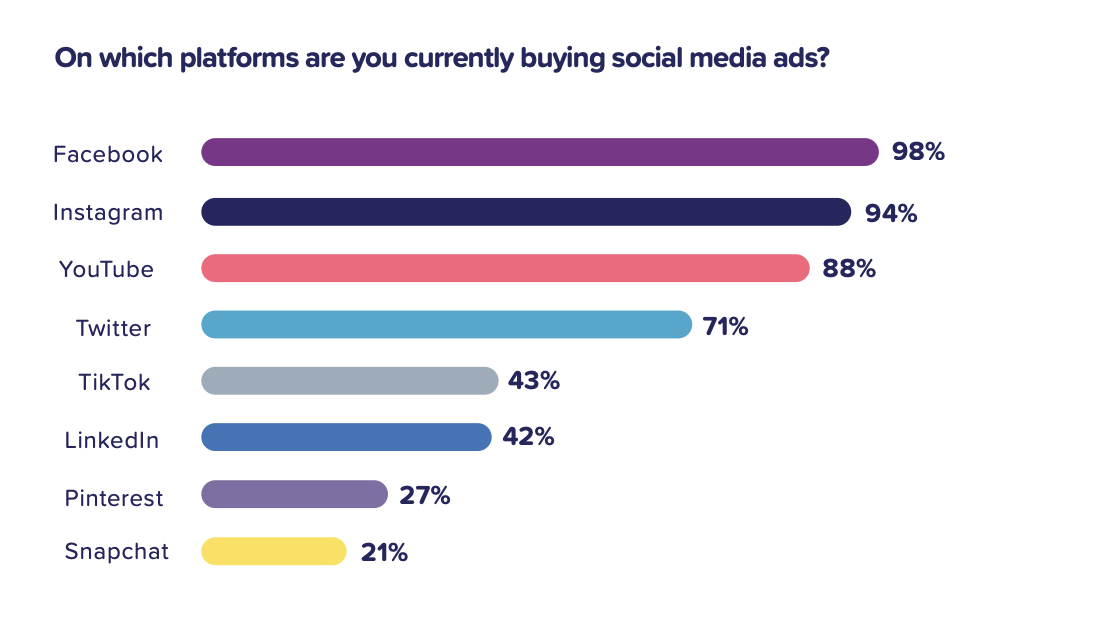
98% of marketers plan to invest in Facebook ads – Source
On the other hand, Facebook is far from the fastest-growing social media network.
Alphabet’s profit was up 36% to $20.64 billion in Q4, 2021, while Facebook was reported to lose users.
Then again, this comparison should be taken with a grain of salt as Google’s parent company has a more varied product package than Meta.
3. 51% of B2C advertisers believe in social media advertising
According to Smartly.io’s 2022 Social Media Advertising Report, 51% of B2C marketers plan to dedicate 50% to 75% of their overall marketing budget to social media advertising.
In 2020, only 11% of respondents intended to spend as much.
Such a drastic shift suggests an upward trend in social media advertising generally. But it also hints at the increasing confidence marketers have in the channel.
4. 82% of marketers use social media in marketing
Social media was named the most popular channel by most marketers in 2021, according to a 2021 trends report by HubSpot.
We expect this trend to continue in 2022.
More than 80% of marketers use social media as part of their awareness, acquisition, and retention strategies.
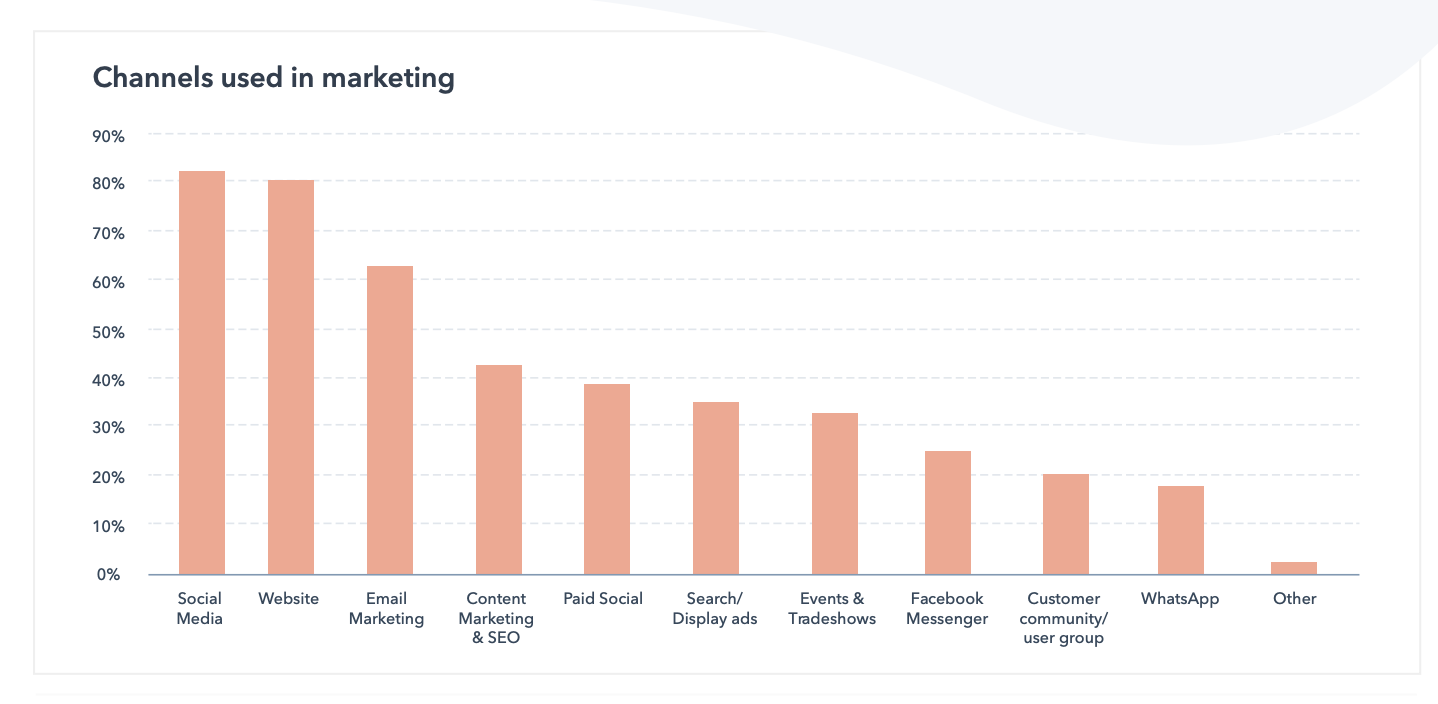
82% of marketers use social media in marketing – Source
5. Facebook is the TOP 3 most visited website in the world
According to SemRush data, Facebook was the 3rd most visited website globally in December 2021.
It’s unlikely that any brand will catch up with the three digital giants leading the pack.
6. 62.7% of Facebook.com visits are mobile
We step into 2022 knowing that most Facebook users (62.7%) prefer to engage with the social media website on mobile devices.
And consider this: the report doesn’t consider the visits to Facebook, Instagram, and Messenger mobile apps. This means that the rate is even higher.
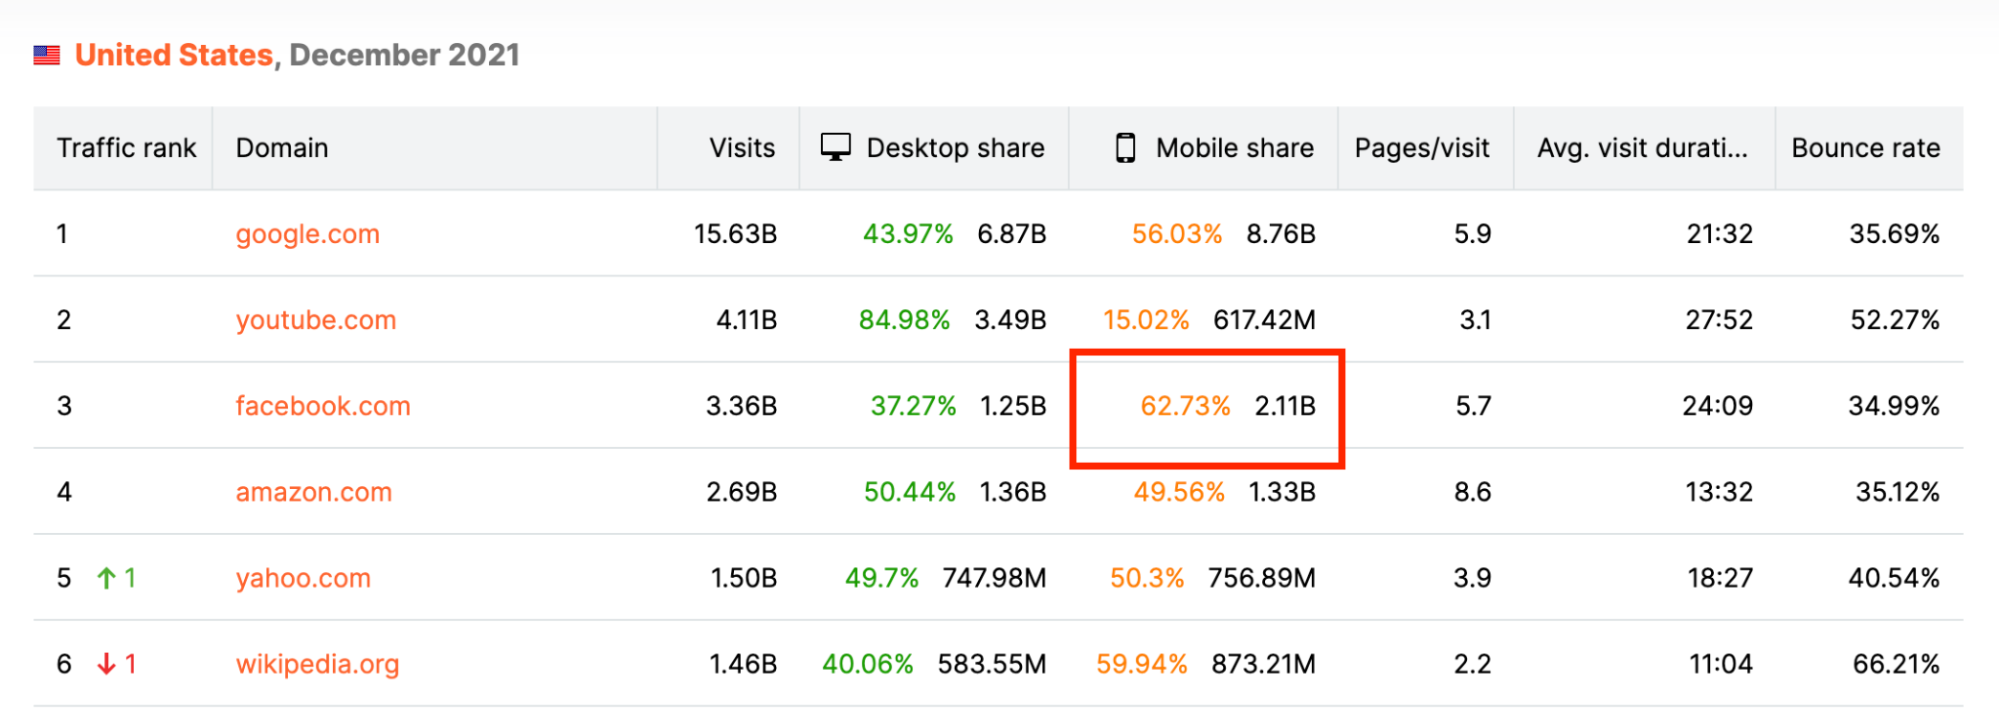
62.7% of Facebook.com visits are mobile – Source
7. Meta is the #1 platform for mobile app purchases
According to AppsFlyer’s 2021 mobile advertising Performance Index, the Meta platform – Facebook, Instagram, and Audience Network – brought the most results to mobile advertisers.
Meta ads captured the #1 power and volume positions in 3 out of 4 vertical rankings: in-app engagement non-gaming, IAP Gaming, and IAP non-gaming.
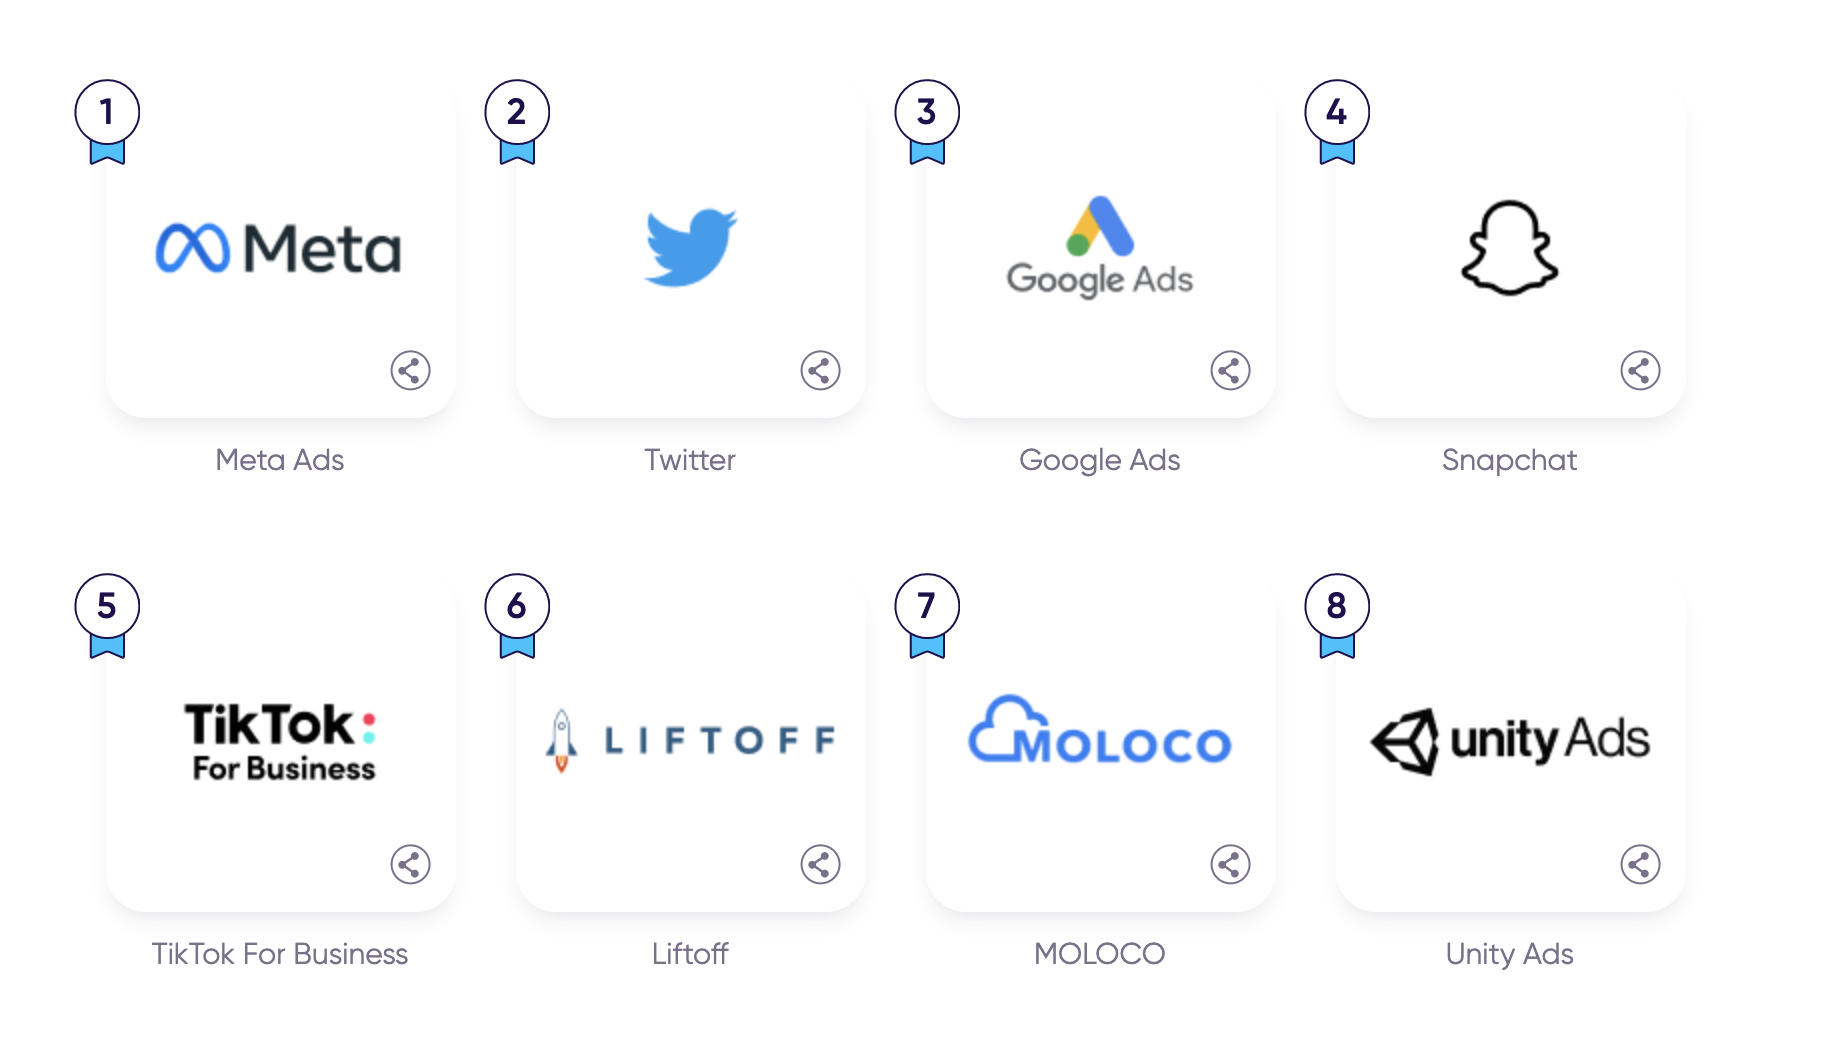
Meta is the #1 platform for mobile app purchases – Source
8. Meta is the #2 platform for mobile app retention ads
When it comes to retaining mobile app users with re-engagement ads, Facebook came in as number two, exceeded only by Google Ads.
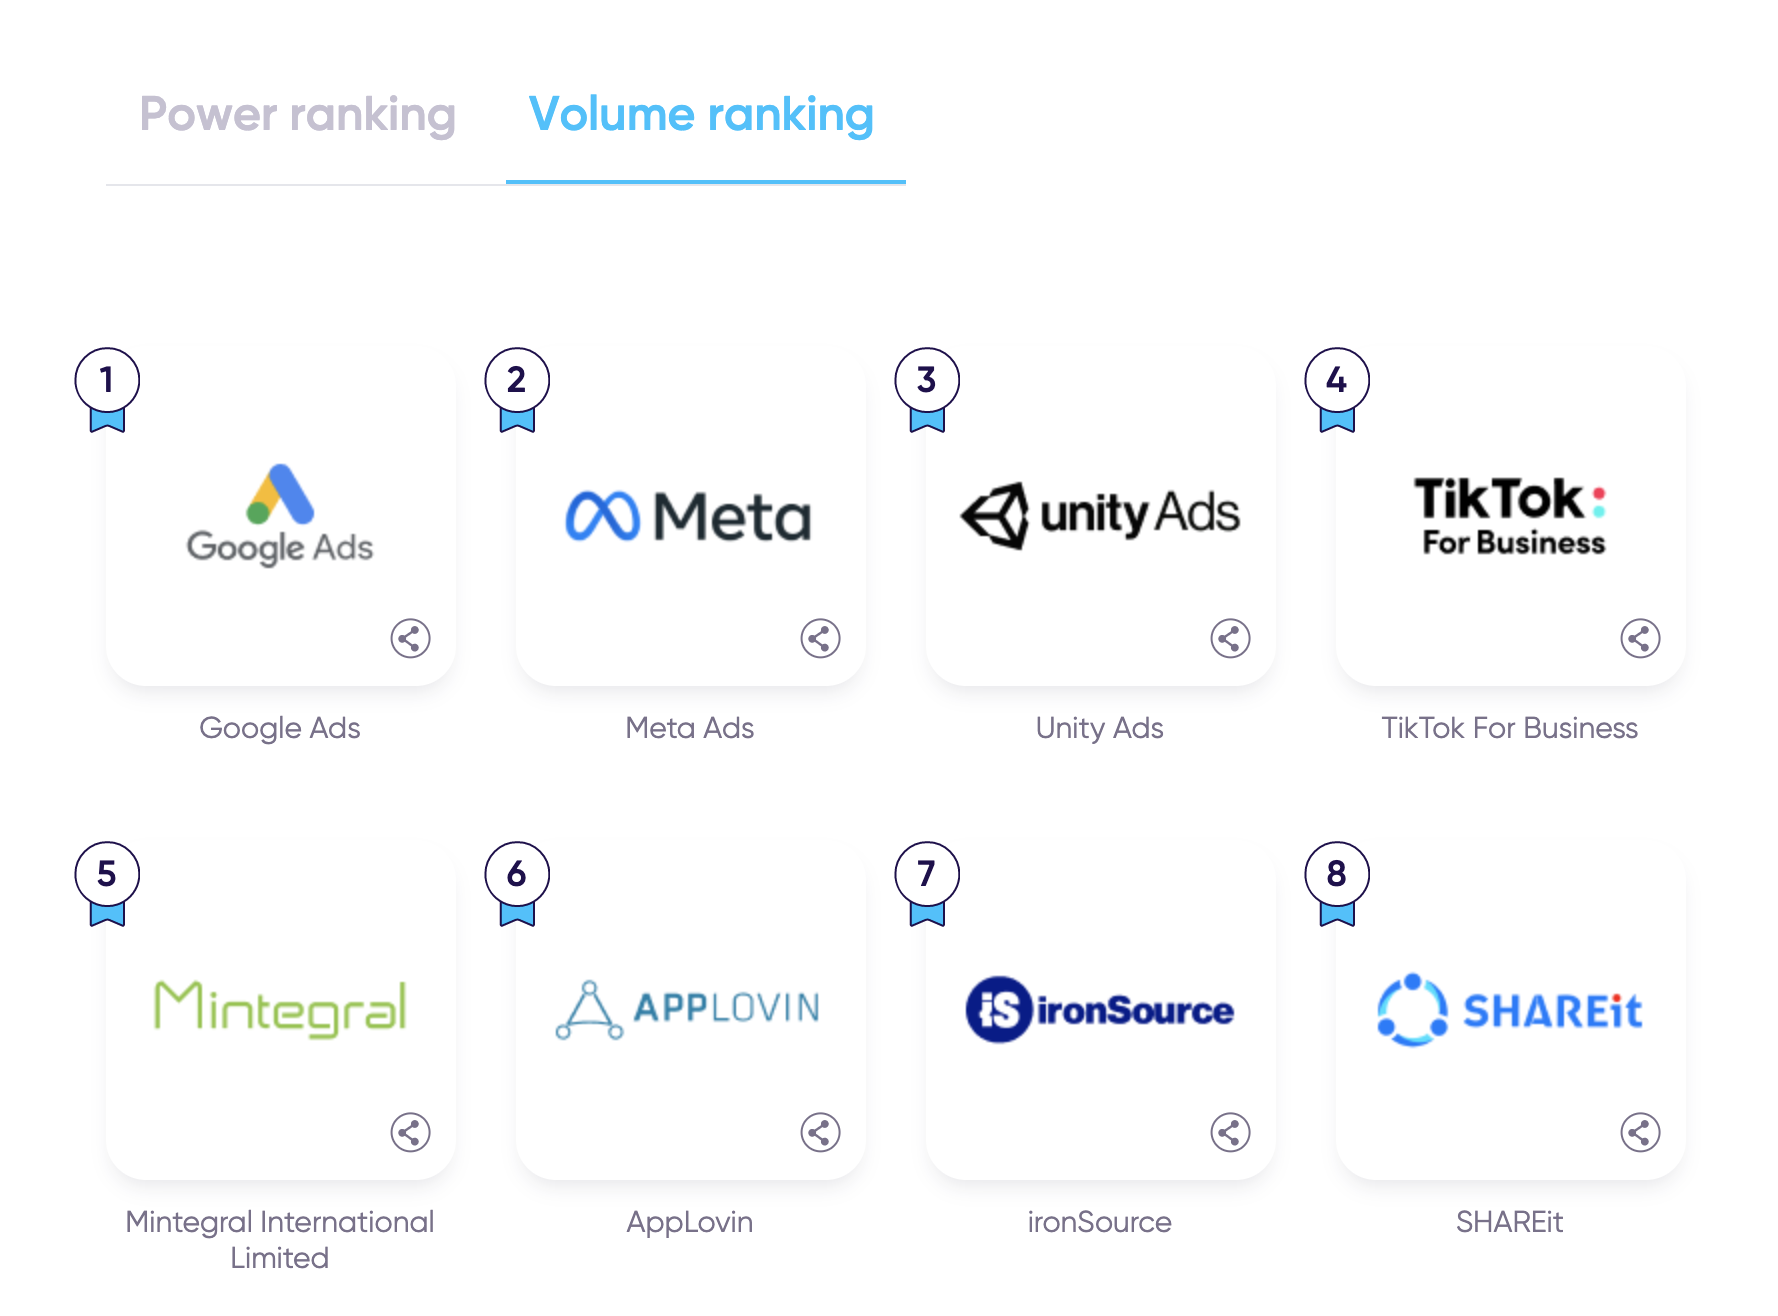
Meta is the #2 platform for mobile app retention – Source
This customer retention statistic is another sign that in 2022, successful advertisers will restrict their time (and ad spend) to a focused few paid platforms.
Advertisers should first invest in scaling performance in the top ad platforms and only expand into other marketing channels if there’s budget and time left.
9. People spend on avg. 19.6 hours per month on Facebook
According to a 2022 global trends report by WeAreSocial, people spend an average of 19.6 hours/month on Facebook.
While it looks like YouTube leads the competition here, consider that Facebook’s ad platform includes Instagram and Messenger.
Combined, Meta is the most used social media platform globally.
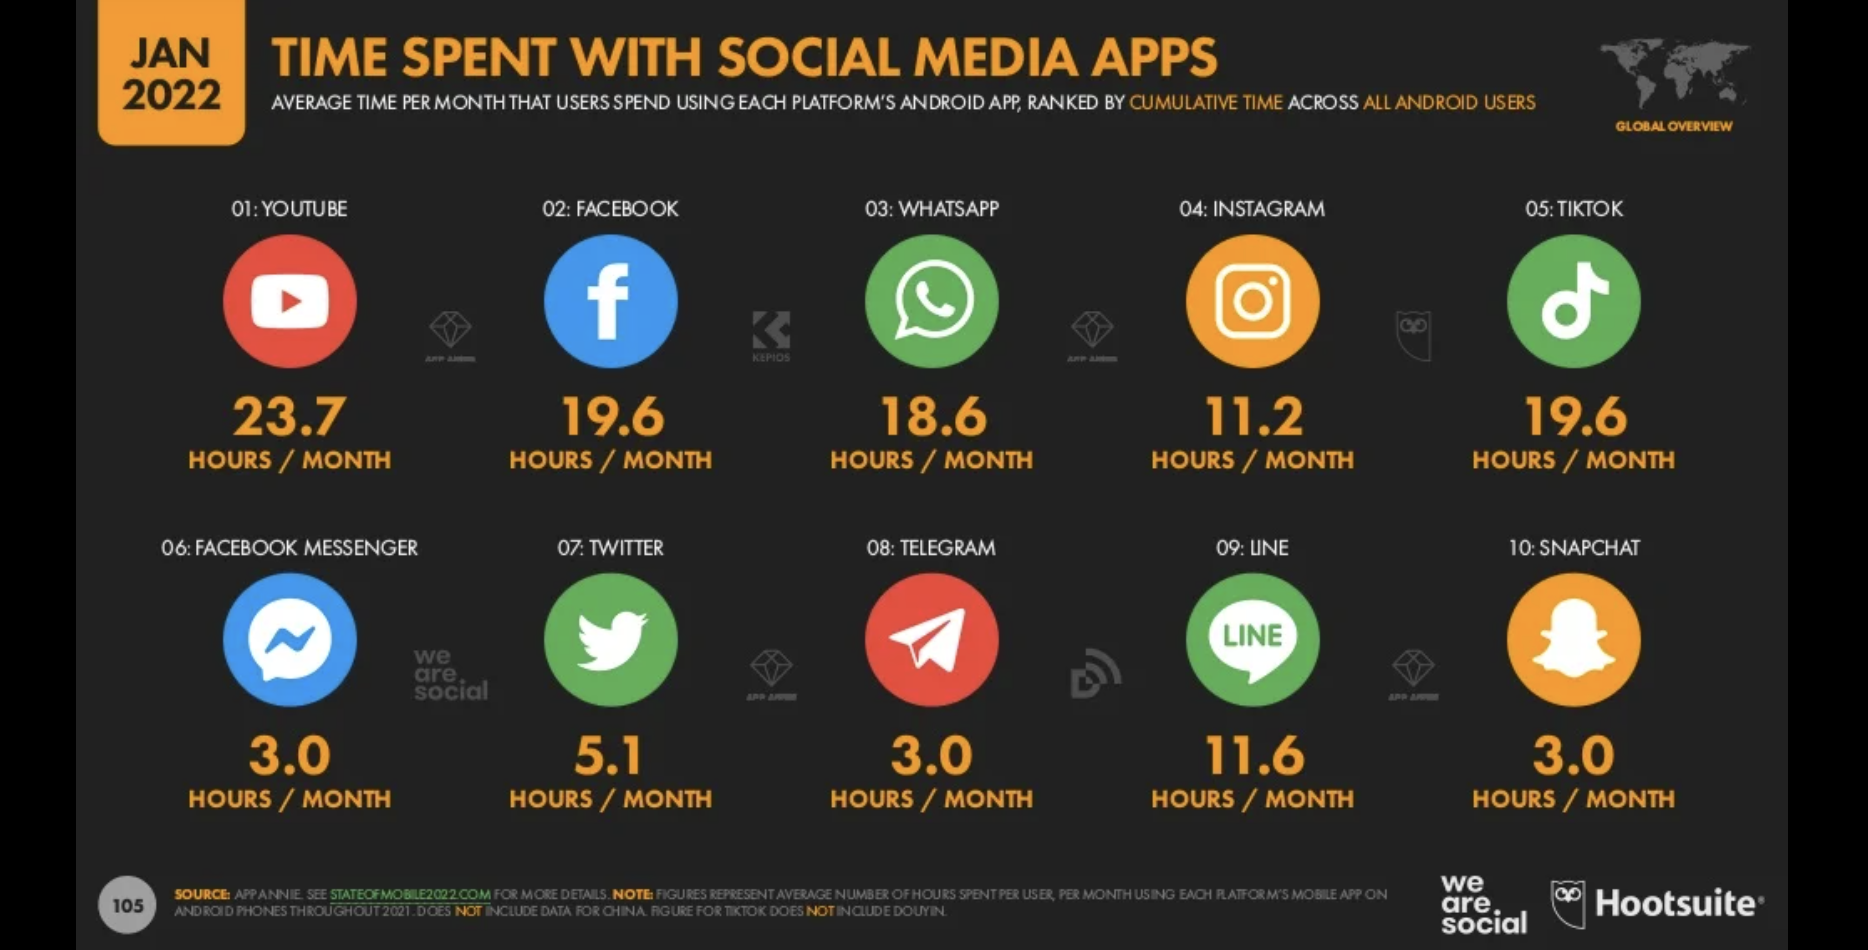
People spend on avg. 19.6 hours/month on Facebook – Source
10. Instagram brings the best ROAS for 48% of marketers
While in 2021, 36% of marketers reported having the highest ROAS (return on
ad spend) from Facebook ads. A step behind, Instagram returned the best results for 29% of the group.
The tables have turned in 2022.
In 2022, 46% of B2C advertisers say they see the best social media advertising return with Instagram ads. You can set up Instagram ads via Facebook Ads Manager.
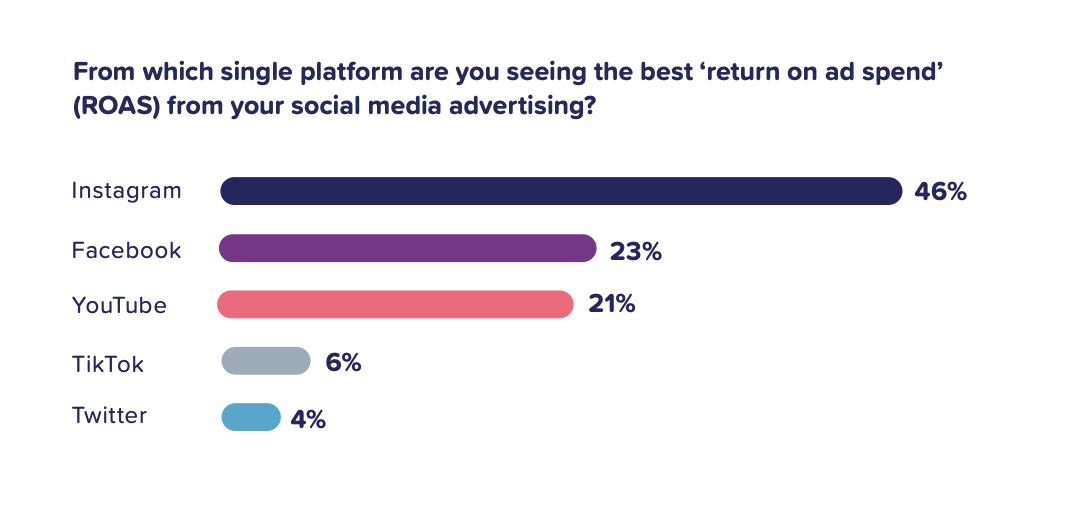
Instagram brings the best ROAS – Source
⭐ Facebook ad performance statistics in 2022
Now that we’ve (hopefully) managed to convince you that Facebook is a marketing channel worth investing in, let’s look at some Facebook ad statistics that will help you understand your campaigns’ performance.
11. The average Facebook ads CPC in 2022 is around $0.97
Many factors affect your Facebook ads cost: industry, audience, country, campaign objective, optimization, creatives, placements, competition, and many more.
Therefore, it’s difficult to give just one cost-per-click benchmark. For most industries, the ballpark Facebook CPC (cost per click) in 2022 is between $0.80 and $1.10.
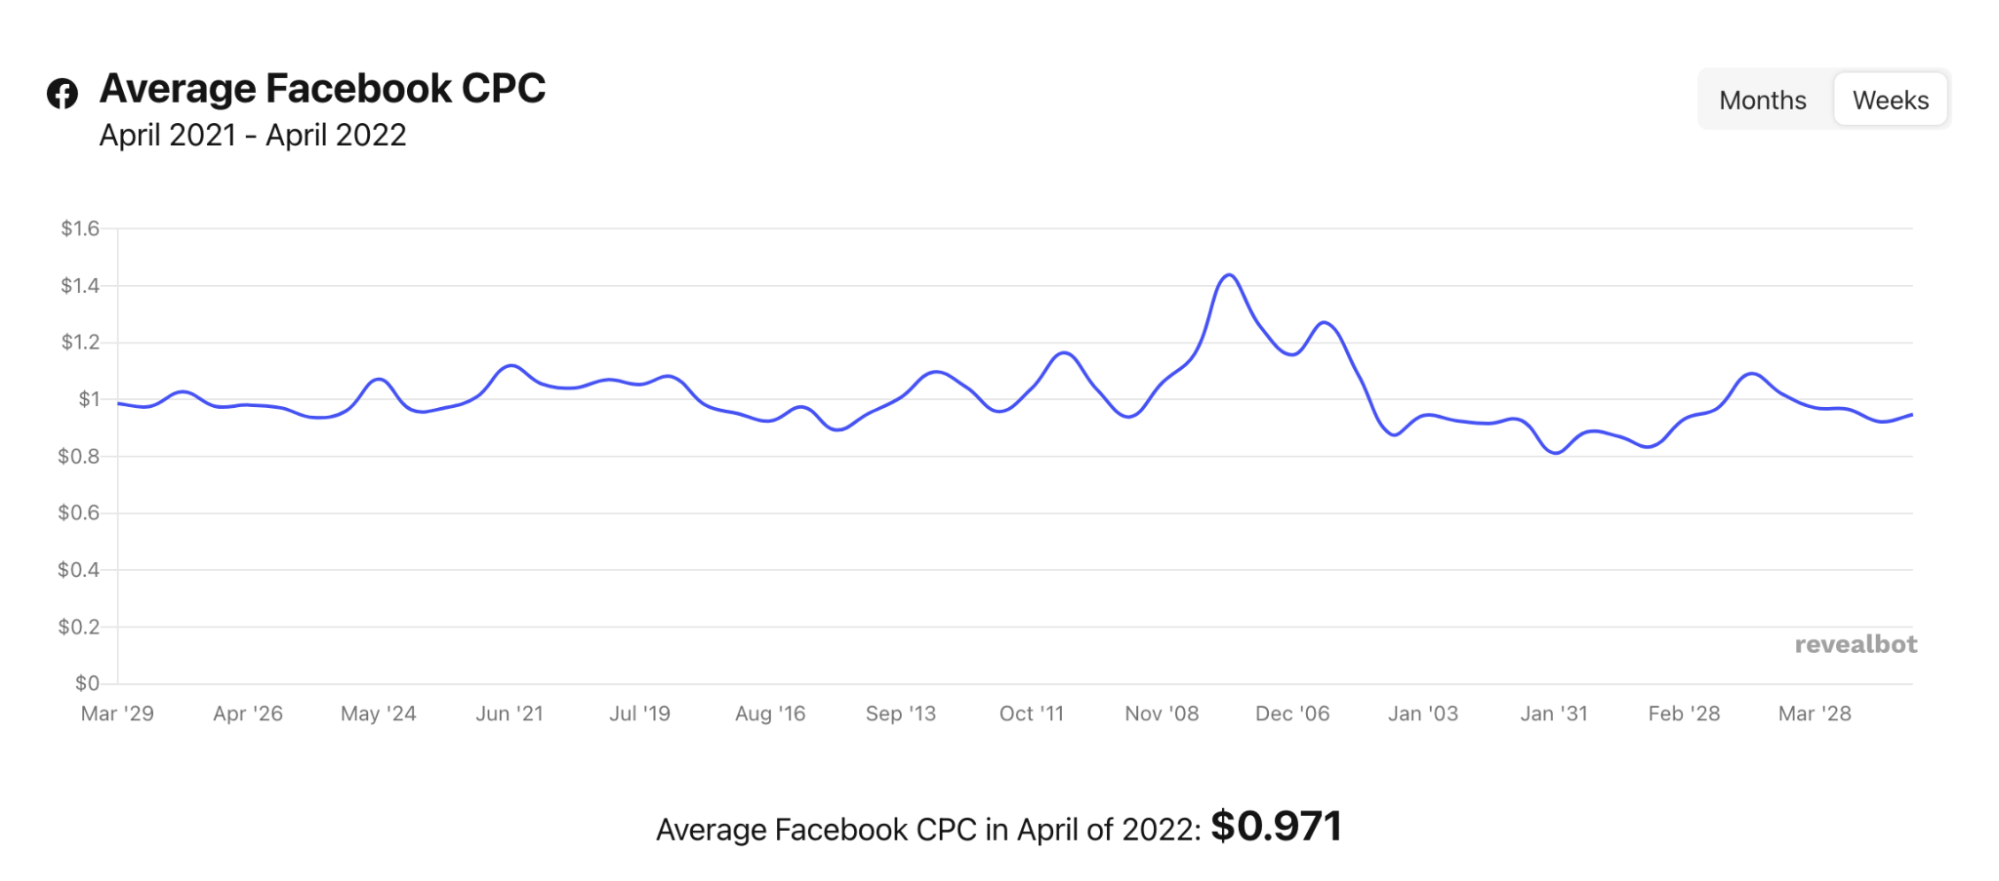
Facebook ads CPC in 2022 is around $0.97 – Source
12. The average Facebook ads CPM in 2022 is around $14
The average CPM (cost per 1000 views) of Facebook ads in April 2022 is around $8.00 – $10.00. However, this number depends on your campaign setup and other variables, just like the CPC figures.
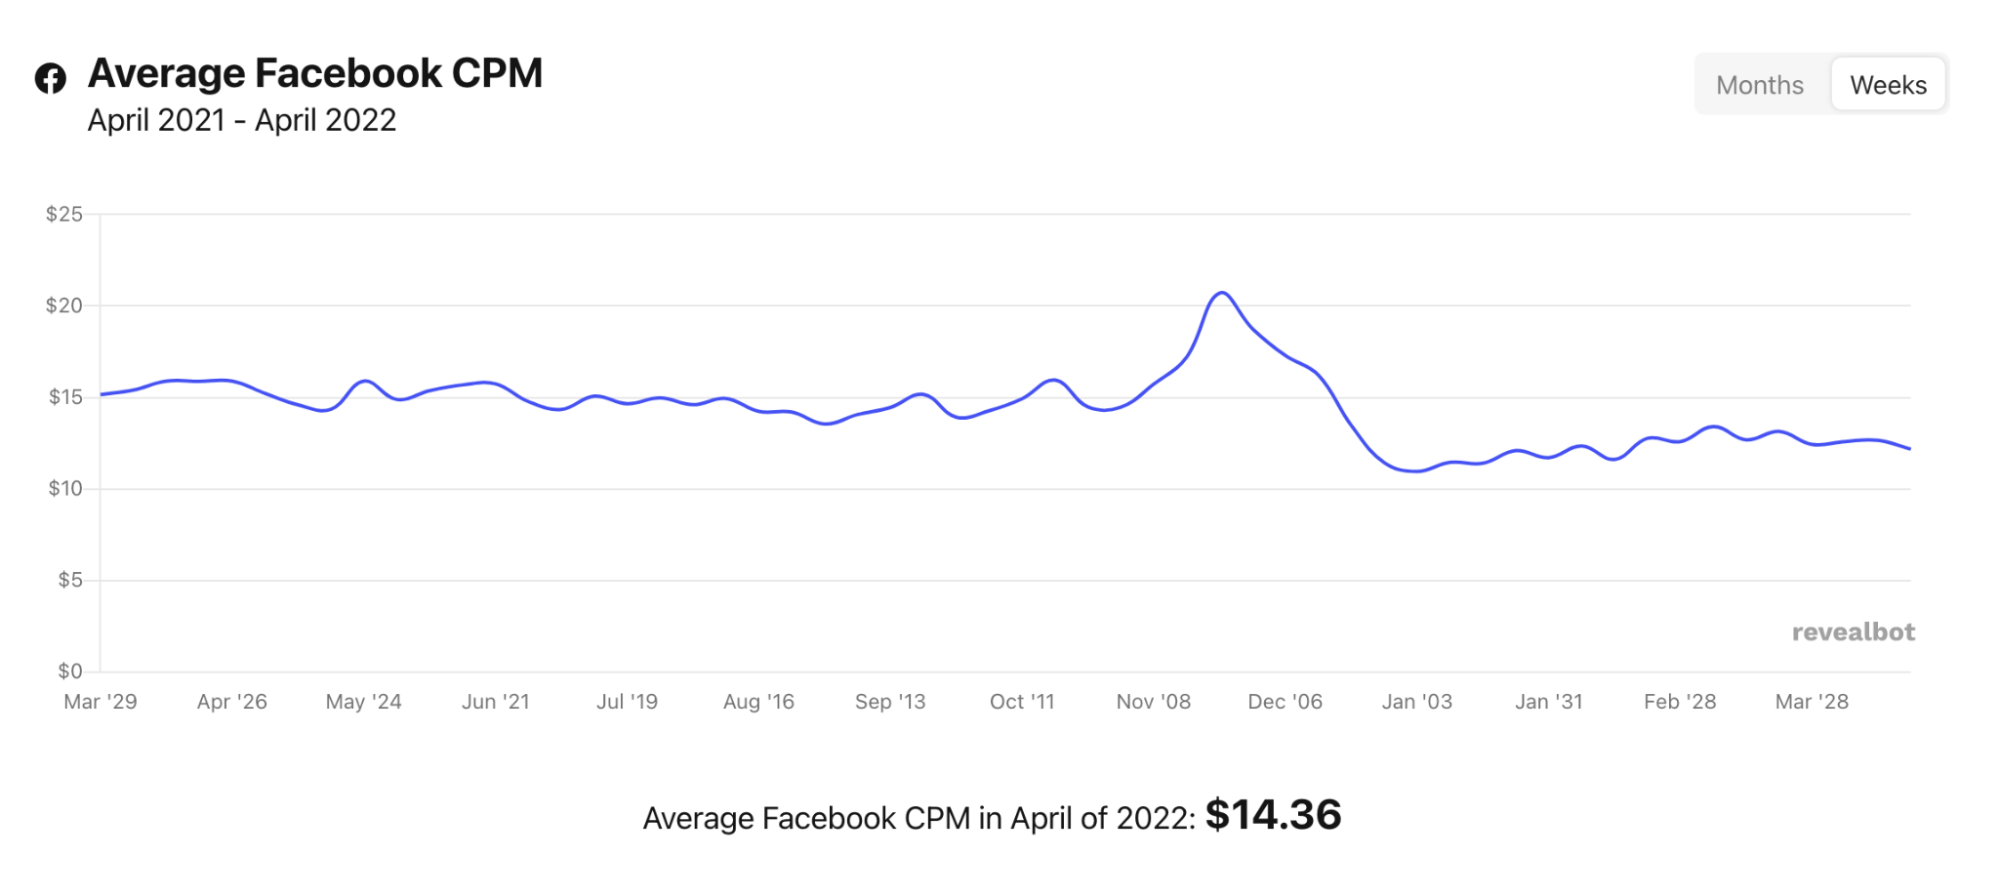
Facebook ads CPM in 2022 is around $14 – Source
One of the fastest ways to uncover the relevant Facebook ad performance benchmarks for your company is to consult an advertising agency with data from other clients servicing your industry.
13. The average Facebook ads CPE in 2022 is around $0.097
CPE – cost per engagement – is what you pay for any user interaction with your Facebook ads. The average Facebook ads cost-per-engagement in 2022 is $0.097.
However, as you can see from the report below, the CPE will vary greatly depending on your campaign objective.
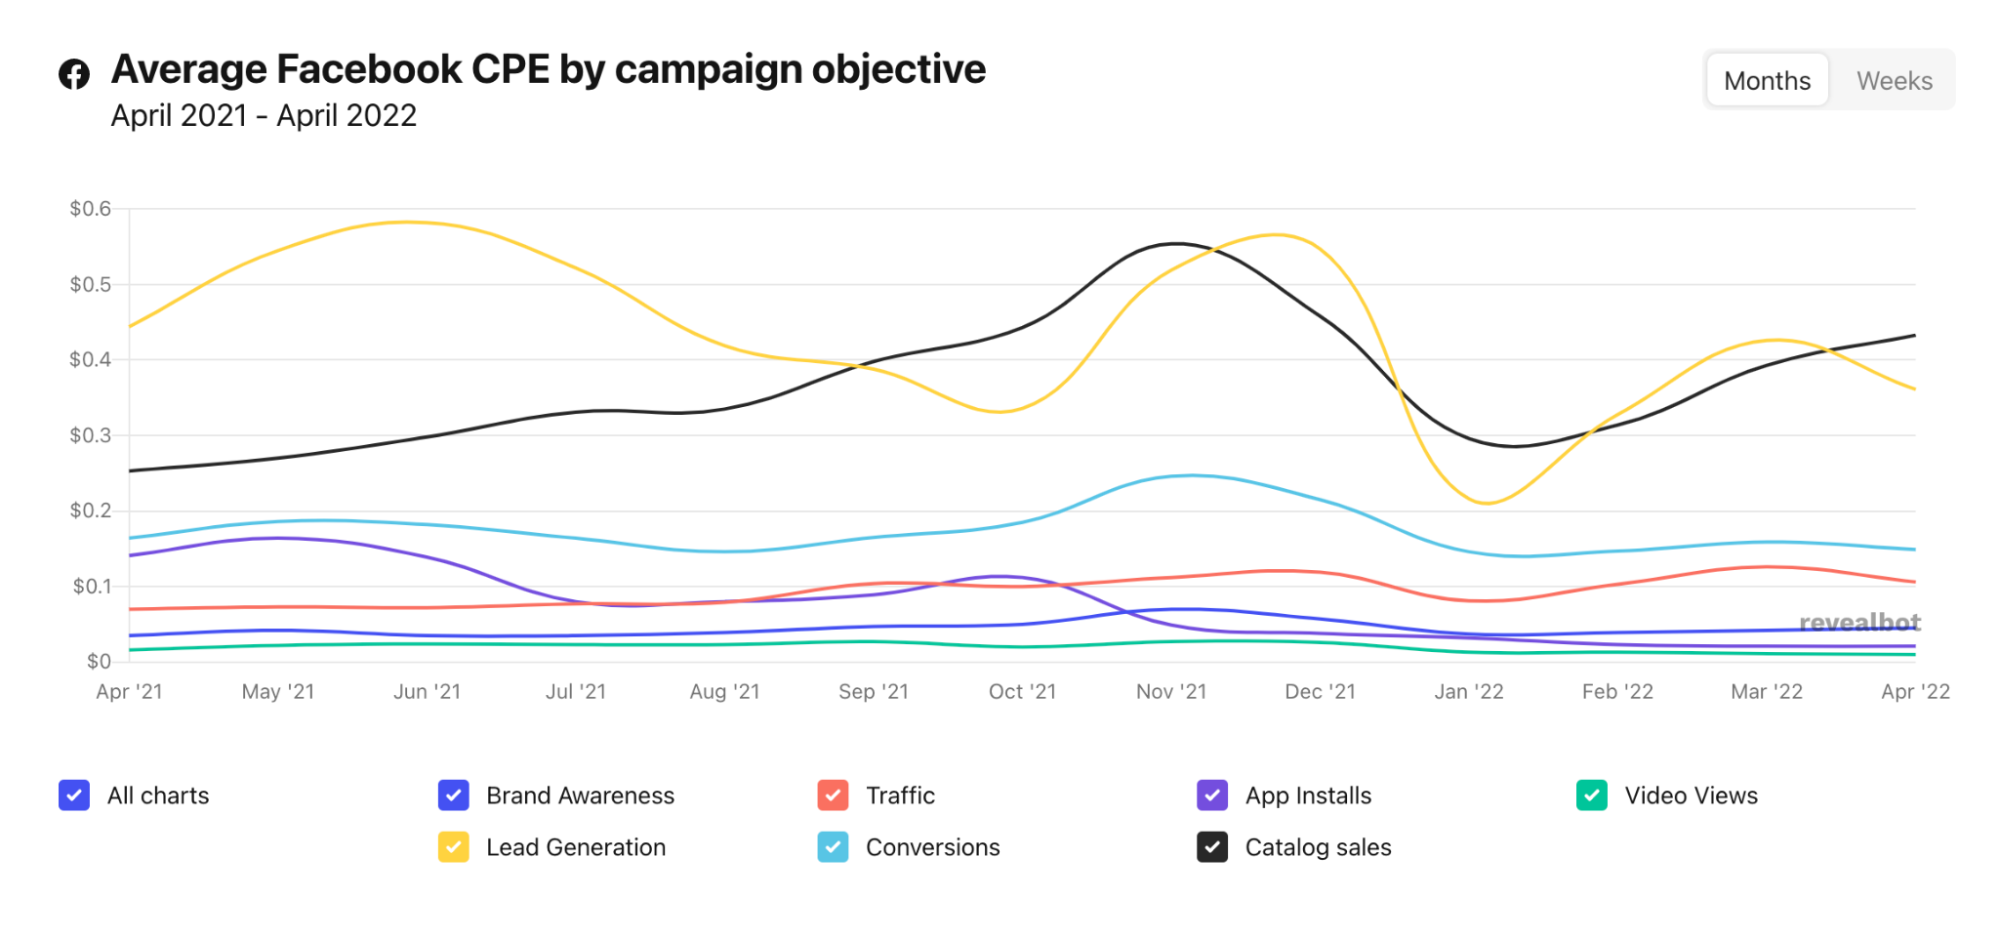
Facebook ads CPE in 2022 is around $0.097 – Source
If you’re struggling with low engagement rates, review your ad campaigns and look out for:
- irrelevant ads or messaging
- boring headlines and copy
- unconvincing offers
Read more: How to Get 1647% More Conversions With The Wedge Method [CRO Case Study]
14. The avg. Facebook ads CTR is 1.32%
According to a 2020 benchmark report by Sidecar, the average click-through rate (CTR) for Facebook ads across all industries is 1.32%.
Some of the highest CTR rates are in the technology and retail industries.
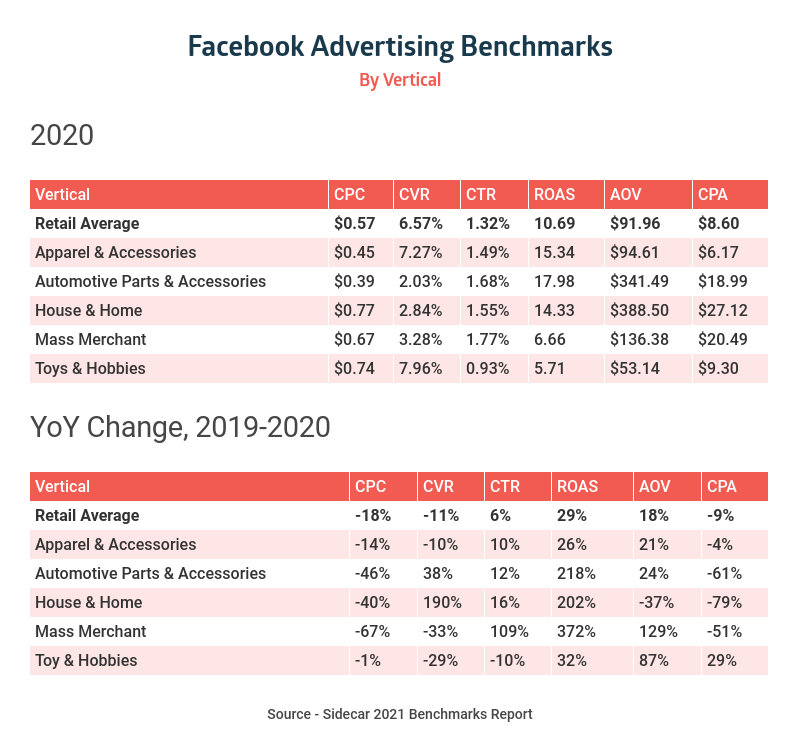
Average CTR for Facebook Ads by Industry – Source
15. The average conversion rate for Facebook ads is 6.57%
The conversion rate shows how many target audience members make the action you wish them to make. This action (conversion) might be a click on your ad or purchase.
The conversion rates tend to be higher for B2C advertisers (note: conversely, B2C conversions are typically less valuable than B2B conversions).
The report by Sidecar showed that the average Facebook ads conversion rate (CVR) is around 6.57%.
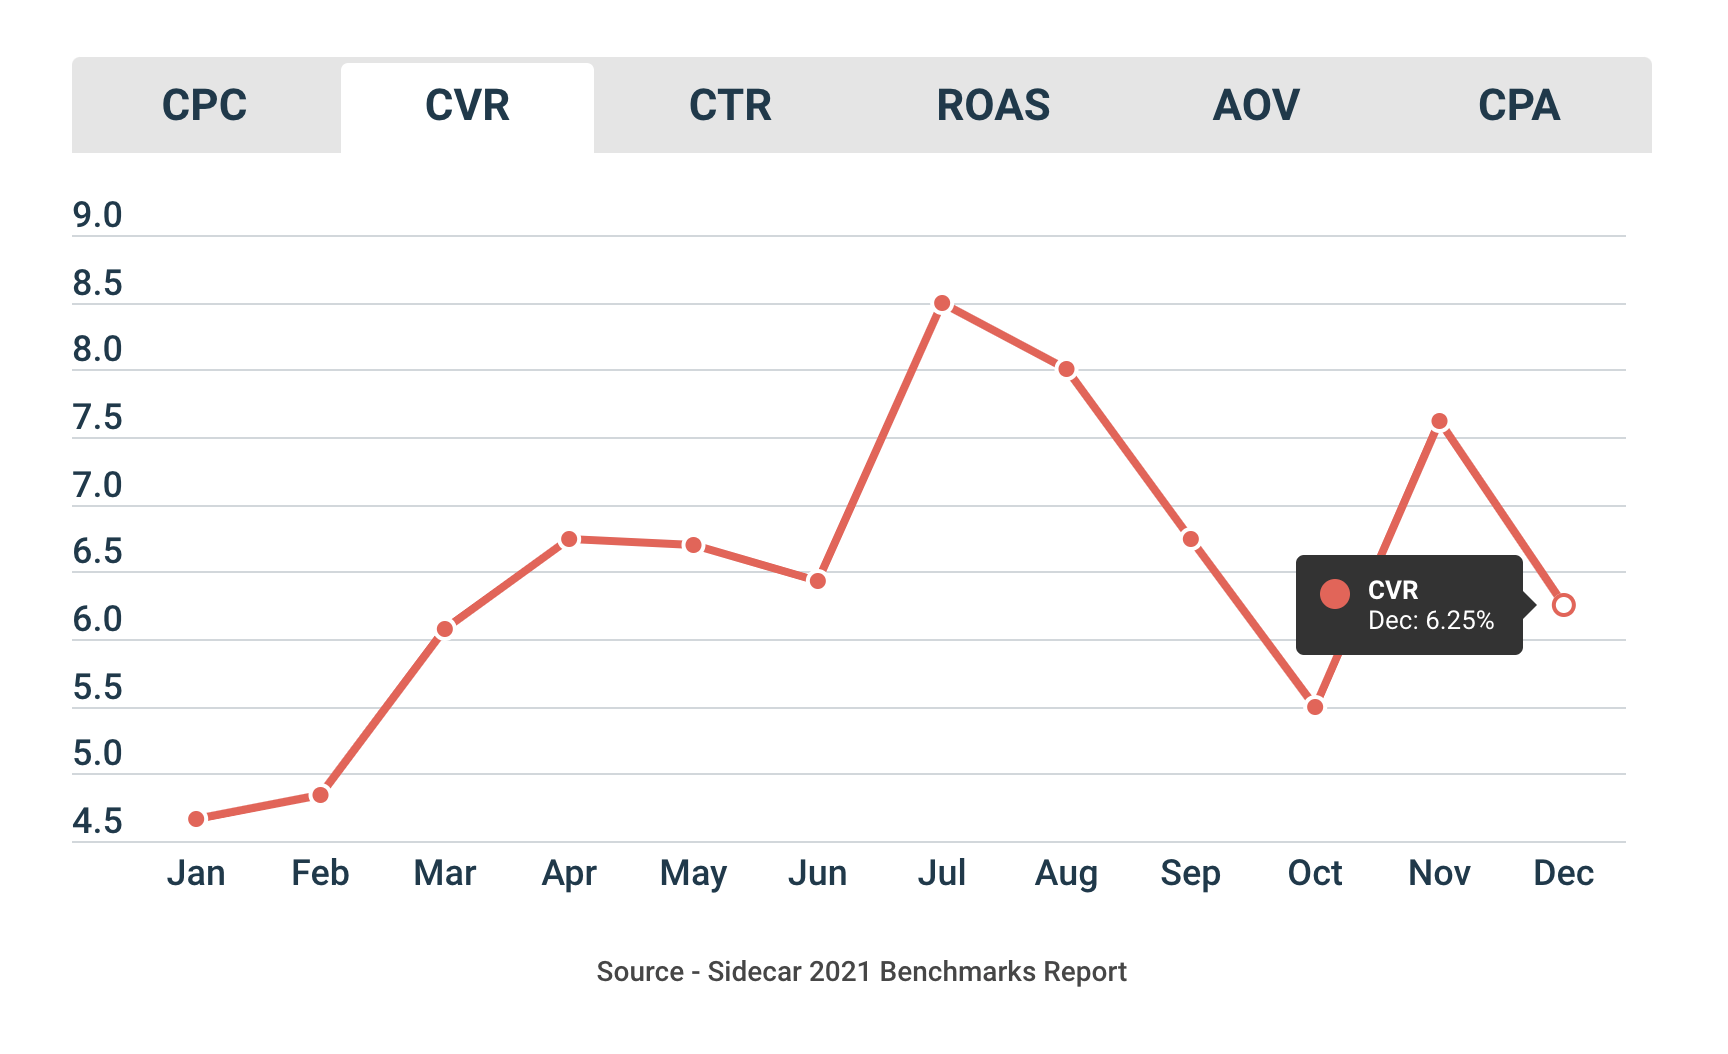
Interestingly, the same report indicates that average conversion rates fell 11% YoY.
Falling conversion rates are likely a sign that the advertising channel is becoming more saturated with new brands and products.
Based on our experience, exposure to remarketing ads can help increase conversion rates over time.
16. The average cost-per-lead of Facebook ads in 2022 is $7.1
RevealBot’s data from April 2022 showed that the average cost-per-lead of Facebook ads is around $7.1. There has been a slight increase in the CPL cost compared to Q4 2021.
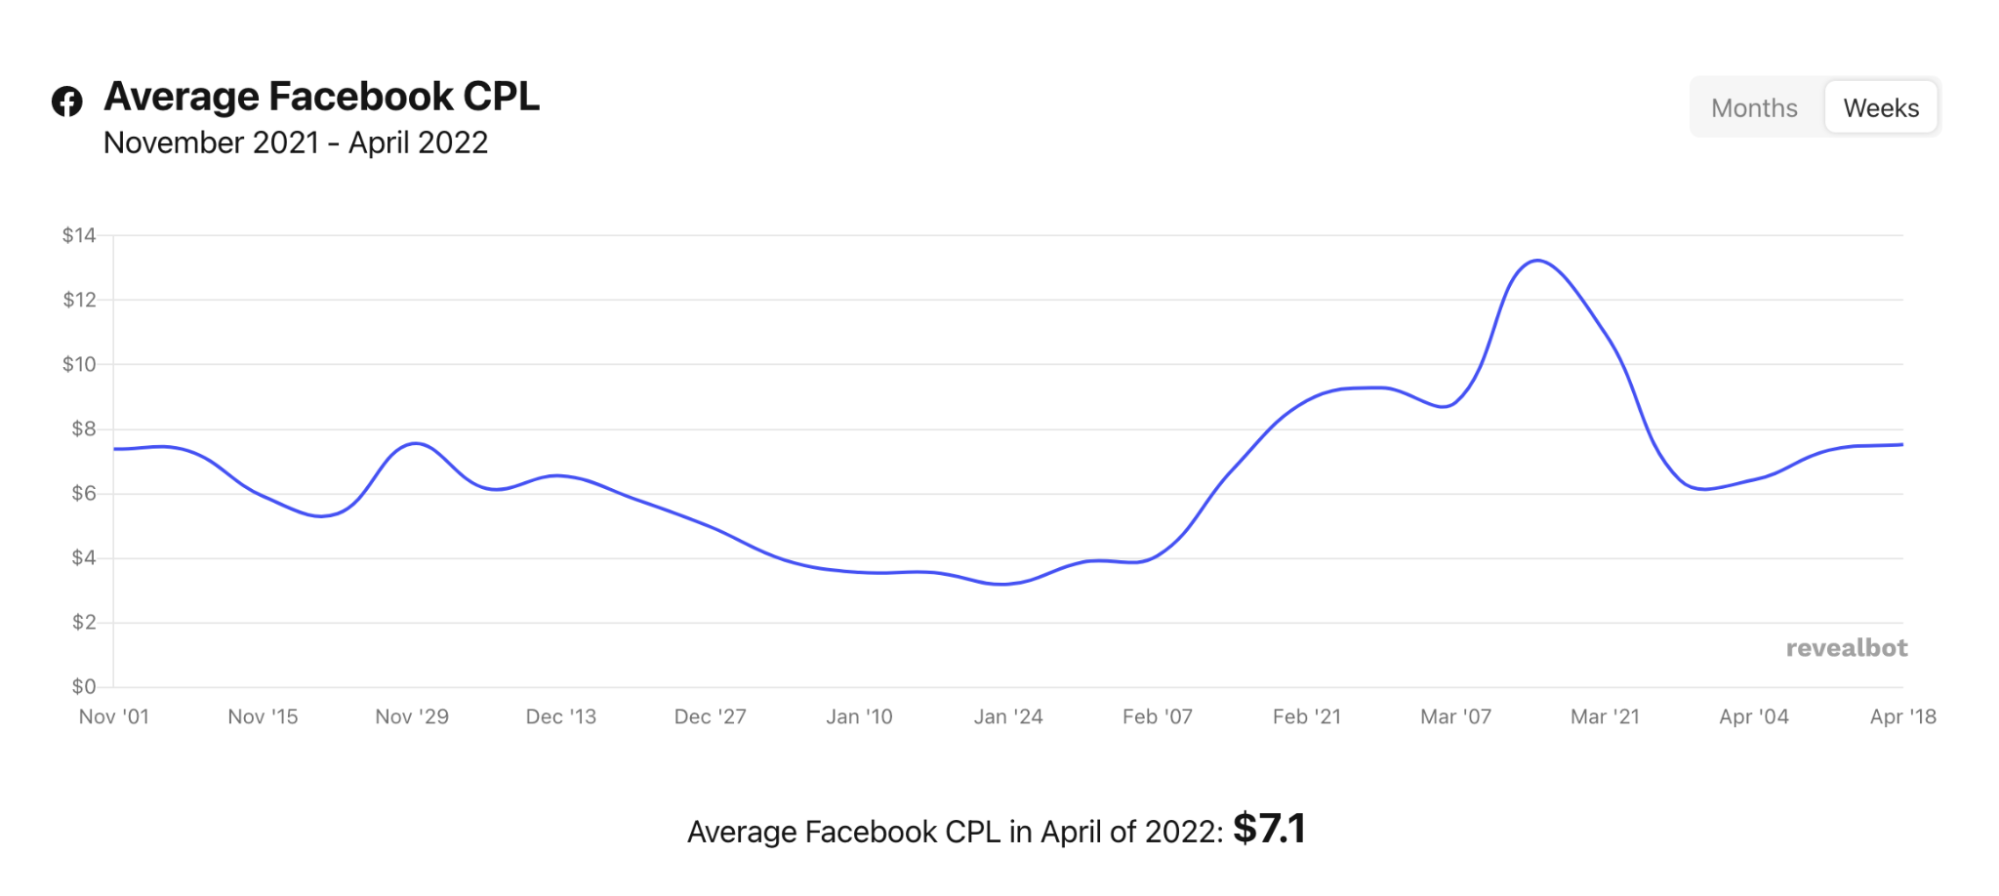
The cost-per-lead of Facebook ads in 2022 is $7.1 – Source
17. The average cost-per-install of Facebook ads in 2022 is $3.3
There’s finally some light at the end of the iOS-14-update tunnel!
Compared to 2021, the mobile app install costs in the Facebook ad network are finally going down. The average CPI of Facebook ads in 2022 is $3.3
This is due to Facebook’s changes to its mobile app tracking and attribution system.
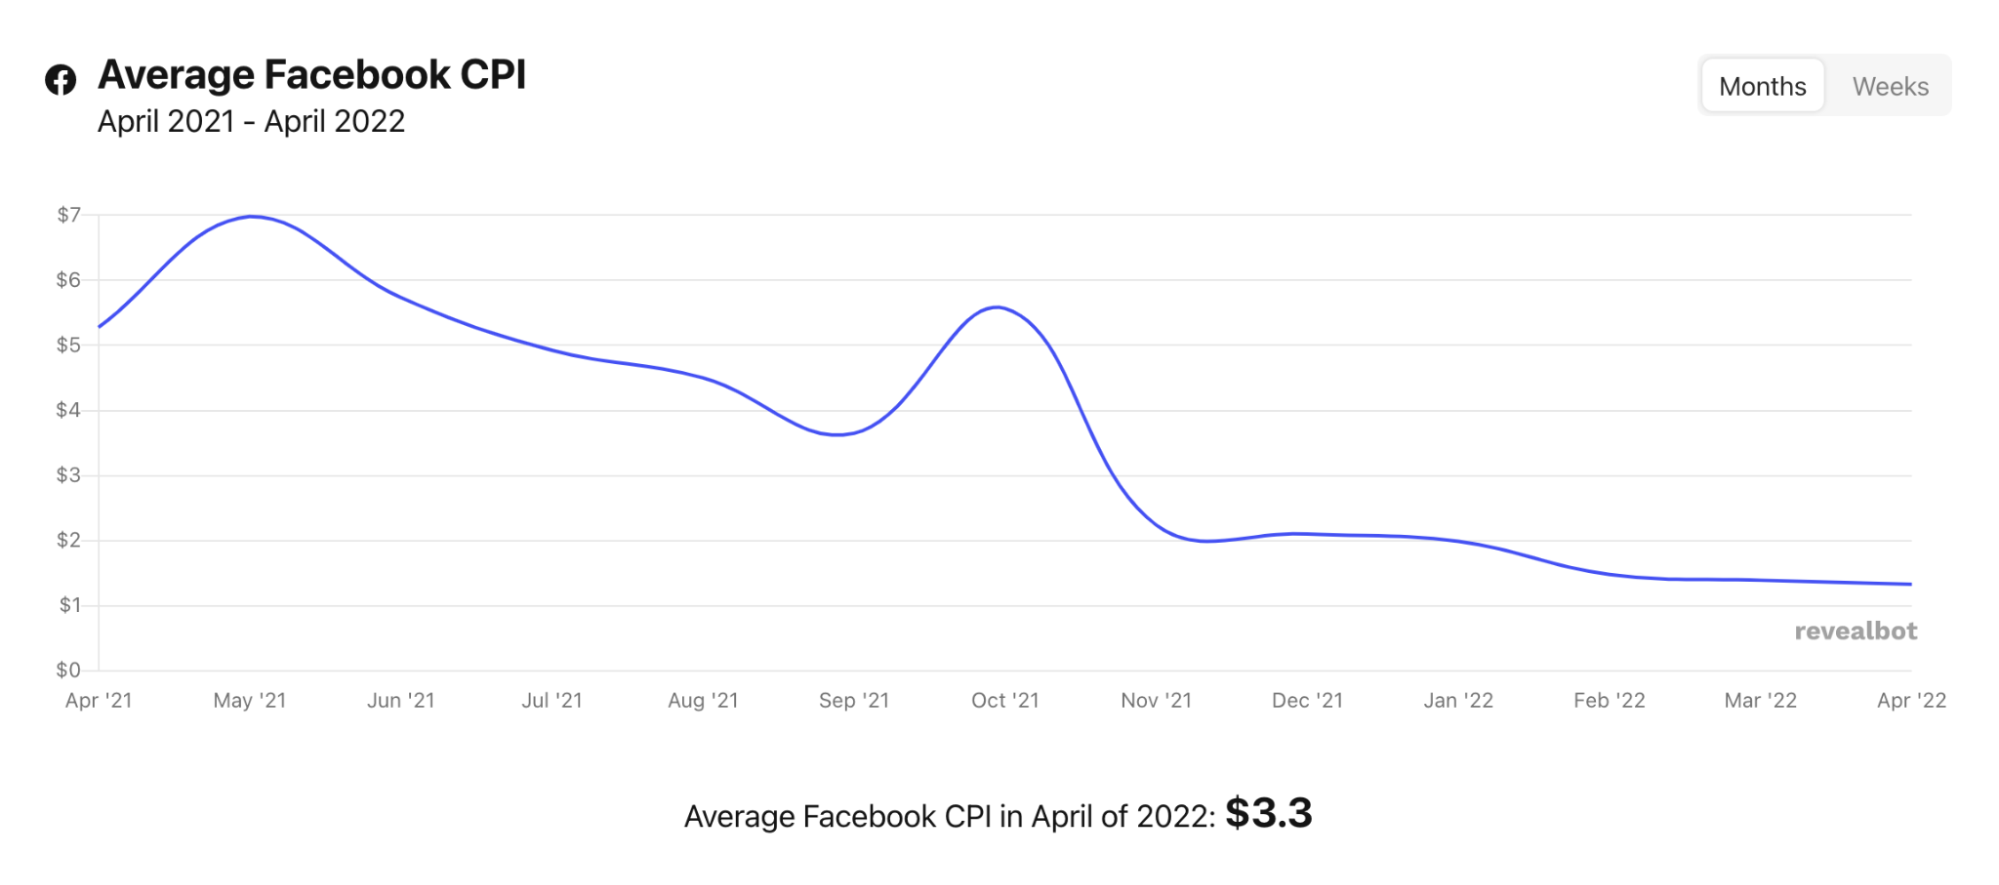
The average cost-per-install of Facebook ads in 2022 is $3.3 – Source
If you have a high CPI, it may be due to several reasons. Look at your Facebook ads and your app store listing to diagnose problems.
18. The avg. organic reach of a Facebook post is 5.2%
According to the latest data by WeAreSocial, the average organic reach of a Facebook post in 2021 was 5.2%
Organic reach has been declining each year, beginning in 2021 with 5.2%. In 2019, it was 5.5%.
This means that advertisers will need to invest more into promoting their posts.
19. Brands publish on Facebook 5.5 times per week
According to the latest data available from Statista, brands make 5.5 Facebook posts per week on average.
However, some industries are heavier publishers, e.g., media, sports, and nonprofits.
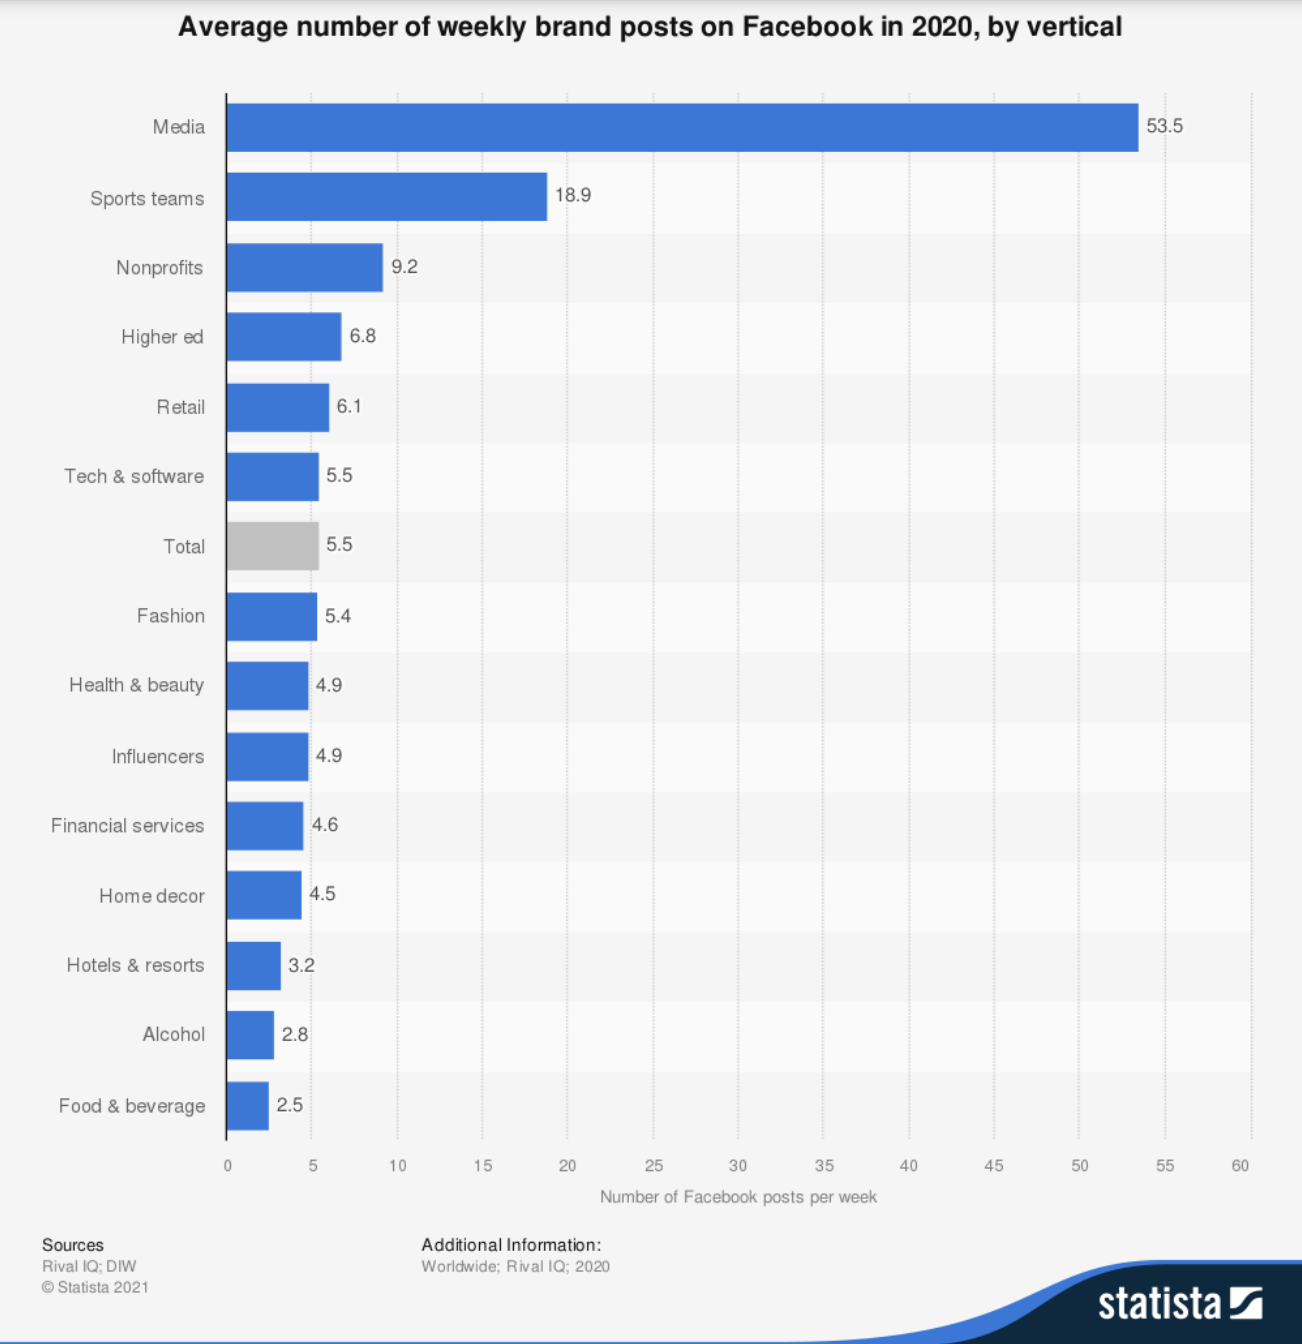
Brands publish on Facebook 5.5 times per week – Source
Now that Facebook’s organic reach is at an all-time low, set aside a small boosting budget for each of your posts.
20. Facebook’s fan page has 214 million followers
Surprise! The most followed page on Facebook belongs to… Facebook! Samsung, Christiano Ronaldo, Real Madrid CF, and Coca-Cola follow behind.
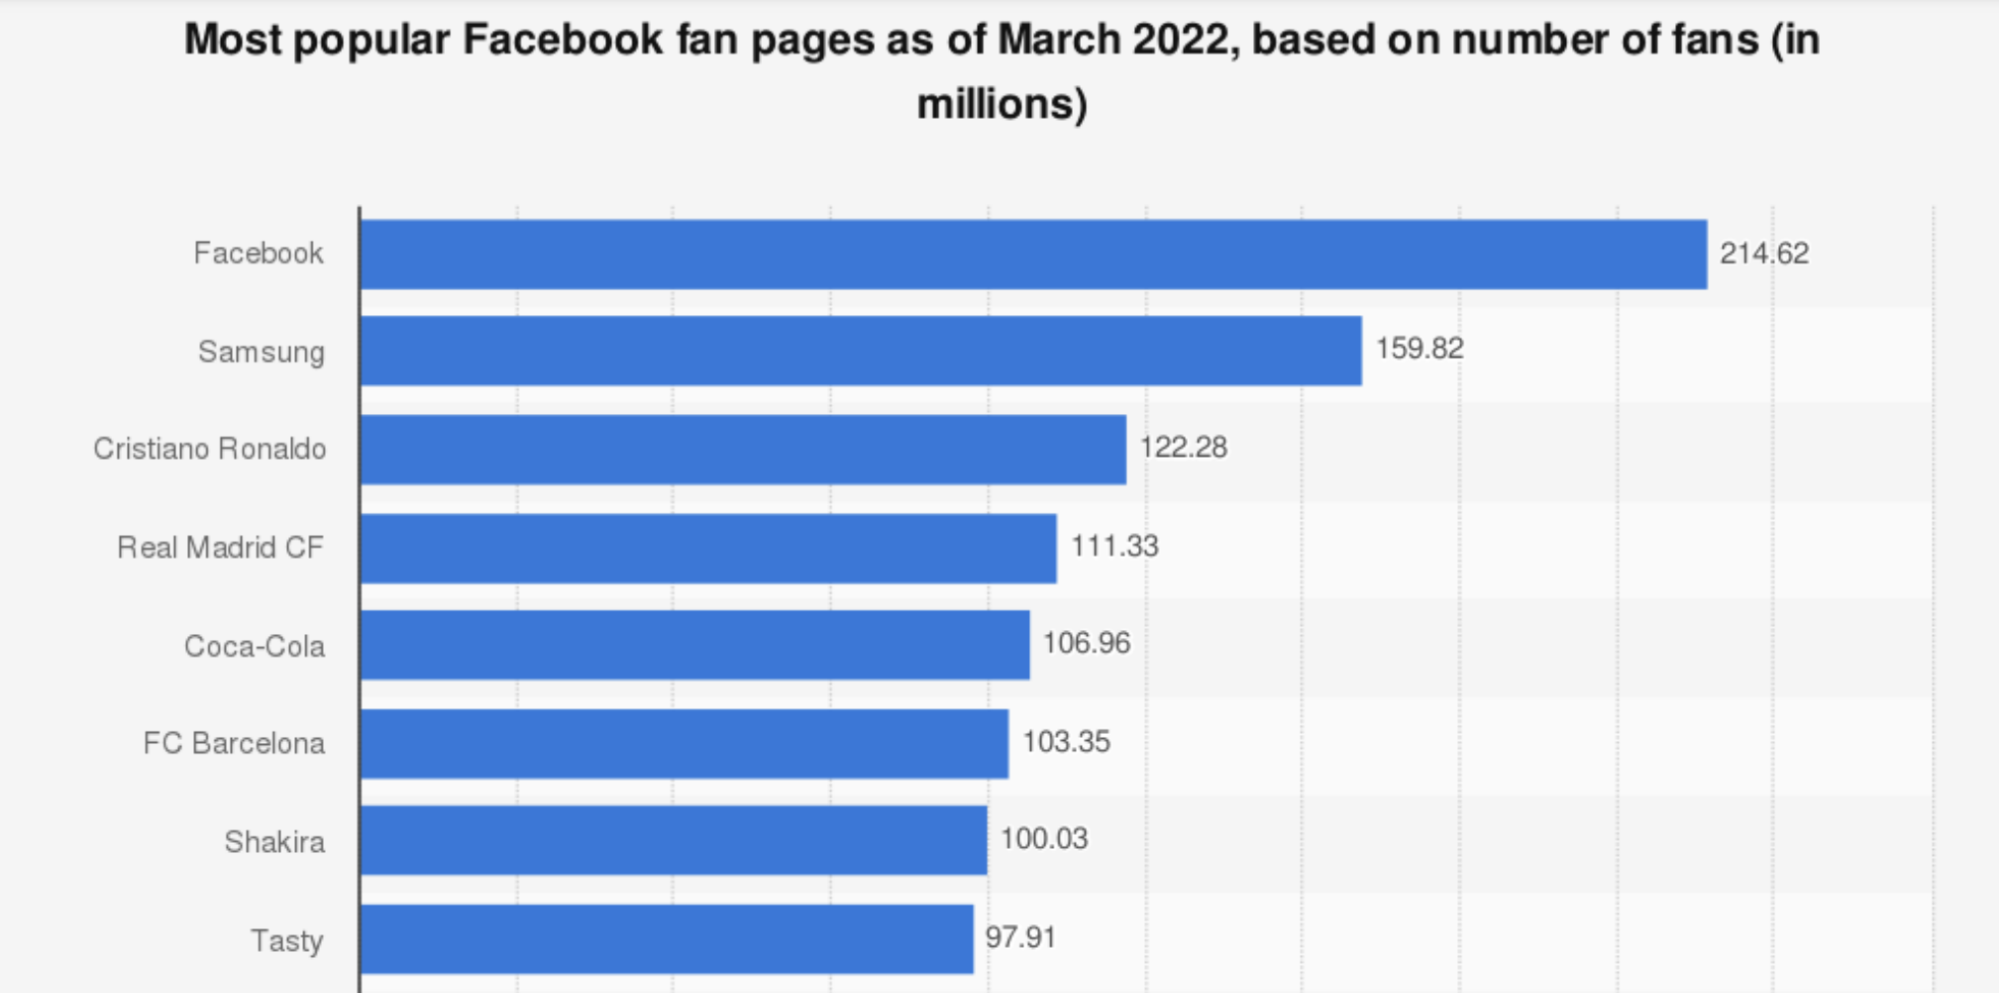
Facebook’s fan page has 214 million followers – Source
21. Facebook’s total revenue in 2021 was $117.9 billion
According to Meta’s 2021 end-of-year investor report, the company’s revenues grew by 37% compared to 2020, and the 2021 total revenue was $117.9 billion.
You could interpret this growth as a positive sign that Facebook will continue to be a reliable social media platform in 2022.
22. Facebook’s ad revenue in 2021 was $114.9 billion
According to the same 2021 end-of-year investor report, Facebook’s ad revenues in 2021 amounted to $114.9 billion.
23. Most of Facebook ad revenue comes from the US and Canada
The biggest contributors to Facebook advertising revenue are the US and Canada. In 2020, advertisers from those locations spent $40.5 billion on Facebook ads.
Considering the steady growth of advertising investment year-on-year, we expect marketers to invest even more in Facebook ads in 2022.
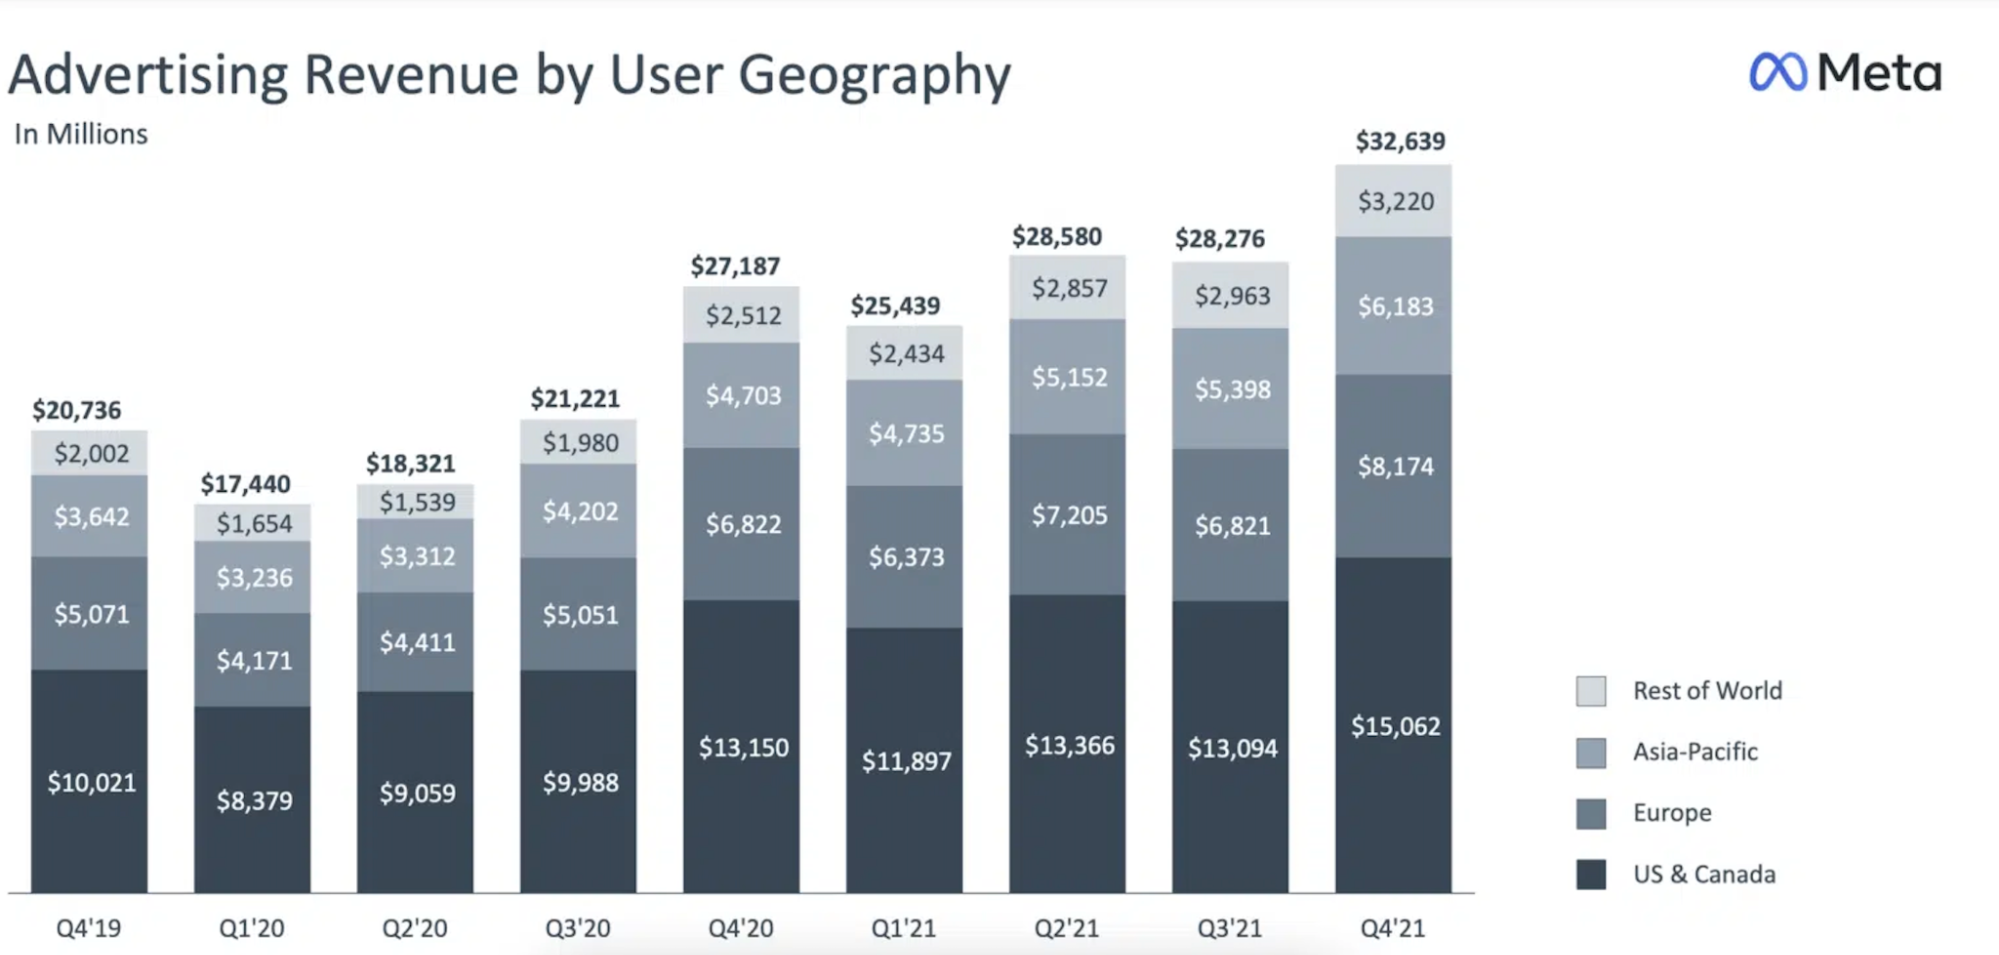
Most of Facebook ad revenue comes from the US and Canada – Source
24. 87% of marketers will increase their Facebook ad spend in 2022
Facebook and Instagram are primed for even more advertisers investing in the two ad platforms.
In 2022, 87% of marketers will invest more in Facebook ads, and 73% of advertisers plan to ramp up their Instagram ad budgets.
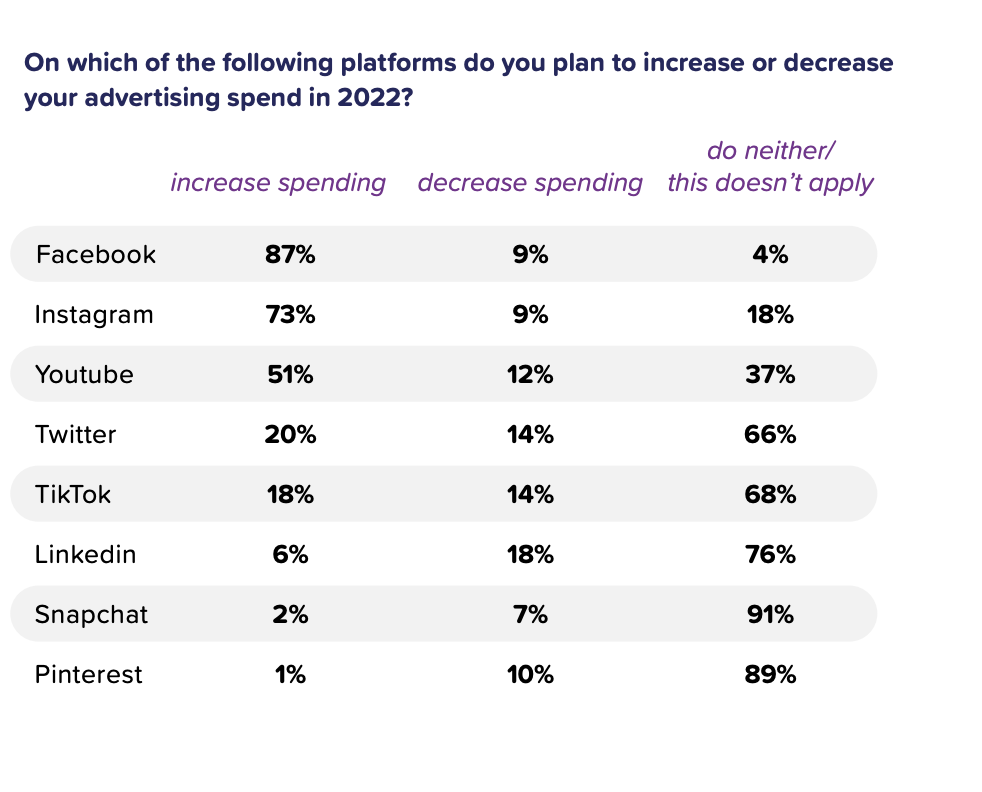
87% of marketers will spend more on Facebook ads in 2022 – Source
25. Facebook has over 10M advertisers on the platform
According to the latest available data from Statista, in Q3 2020 Facebook had more than 10 million active advertisers on its platform.
If you’re not yet advertising on Facebook, you’re missing out on reaching 3.59 billion people across the globe.
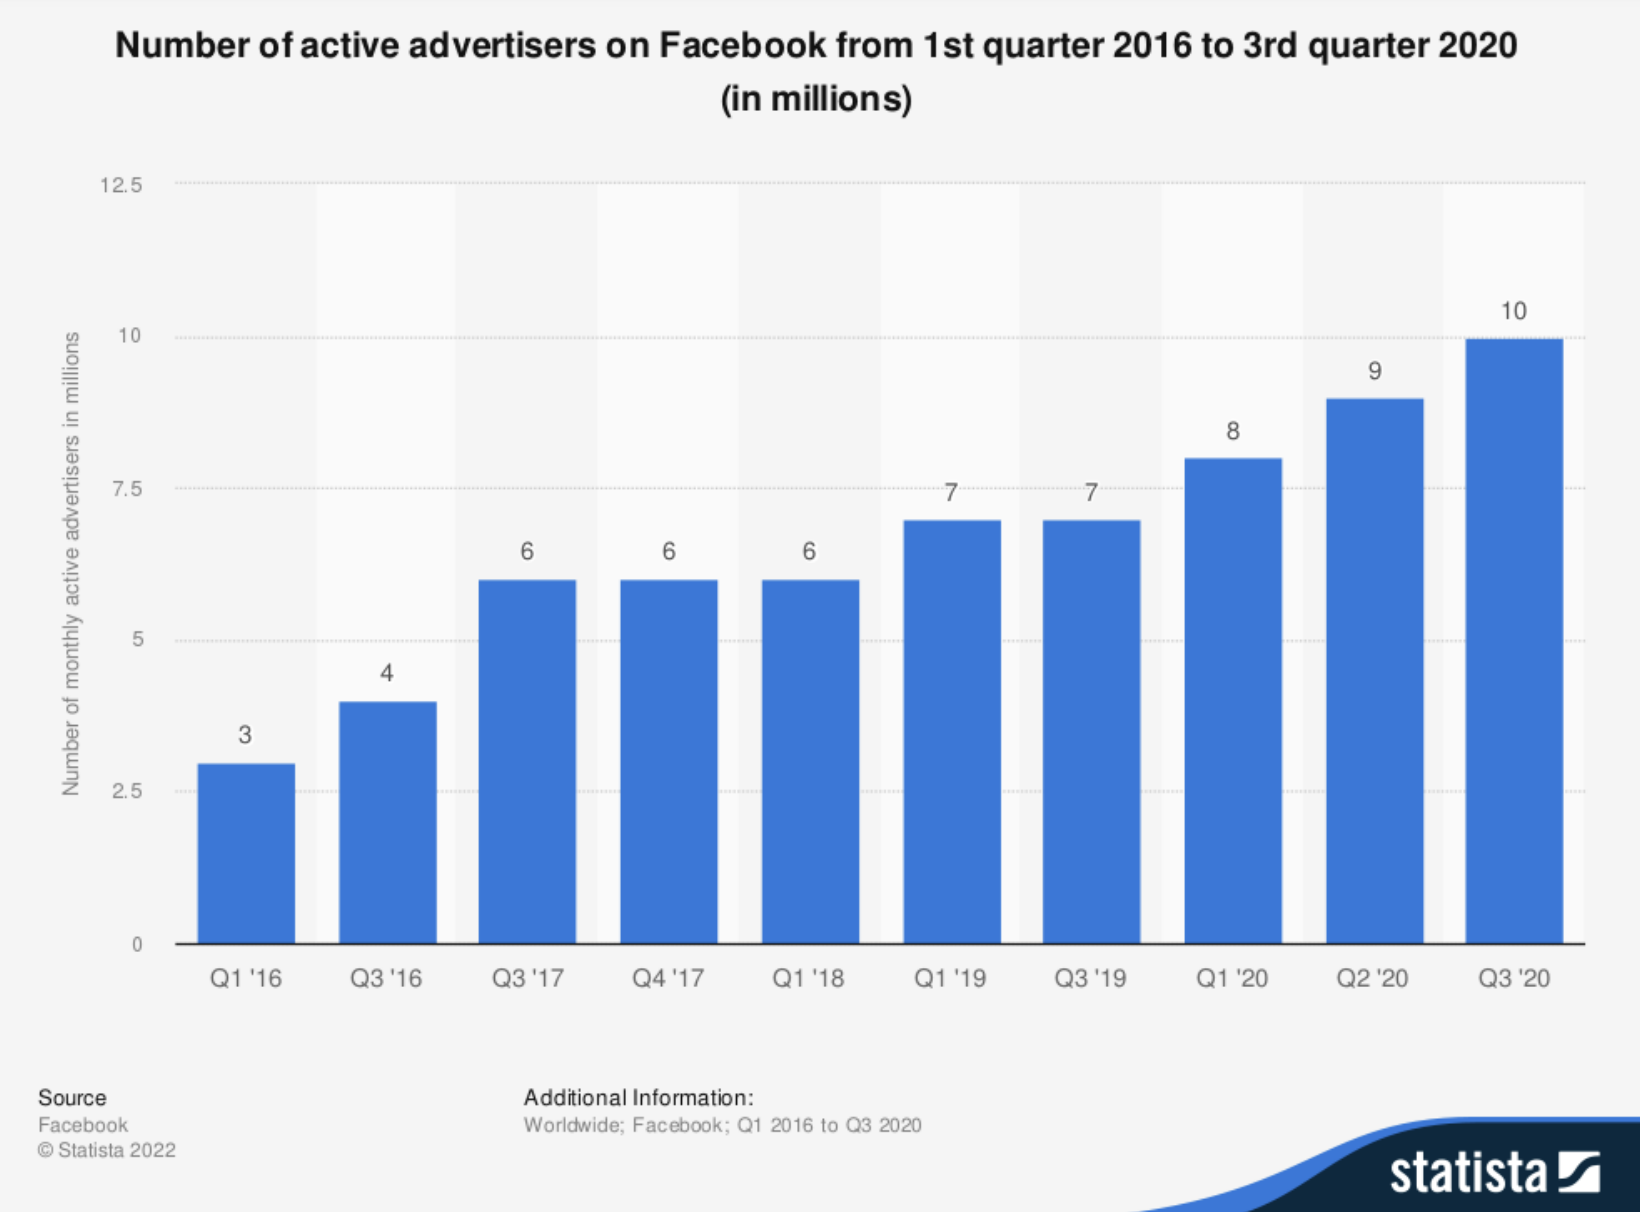
Facebook has over 10M advertisers on the platform – Source
26. Facebook ad impressions increased by 13% in 2021
According to the latest Facebook investor report, in the fourth quarter of 2021, ad impressions delivered across their family of apps increased by 13% year-over-year.
27. The avg. price per Facebook ad increased by 6% in Q4, 2021
Facebook reported in Q4 2021 that its ad prices increased on average by 6% quarter-on-quarter.
Given the previous Facebook ad statistics citing an influx of advertisers (and advertising dollars), rising ad prices will likely be a trend that stays.
More bids for ad space will continue to drive CPC (and overall ad cost) up.
28. The avg. price per Facebook ad increased by 24% in 2021
While the quarter-on-quarter increase in the average ad cost on Facebook’s platform was 6%, the total 2021 increase in the average cost-per-ad was 24%.
Advertisers will now see resulting price hikes across their Facebook ad campaigns. Should we brace ourselves for further increases in 2022? – Sadly, we must be ready.
⭐ Facebook audience statistics in 2022
As a marketer, you must know your audience. Especially if you’re about to advertise on a platform with billions of daily active users.
The following 2022 Facebook statistics will be helpful both when defining your customer personas as well as when mastering all the tips and tricks of Facebook ad targeting.
Also, it’s worth mentioning the latest dire premonitions about Meta–a declining user base, as The New York Times reported in February 2022.
A declining user base doesn’t necessarily mean Facebook ads are doomed, but you should be smart with your targeting to reach the right people.

Facebook has 3.59 billion users
29. Facebook has 1.93 billion daily active users (DAU)
According to data by DataReportal, Facebook’s daily active users (DAU) number was 1.93 billion on average for January 2022.
30. Facebook has 2.91 billion monthly active users
According to data by DataReportal, Facebook’s monthly active users (MAU) number was 2.91 billion on average for January 2022.
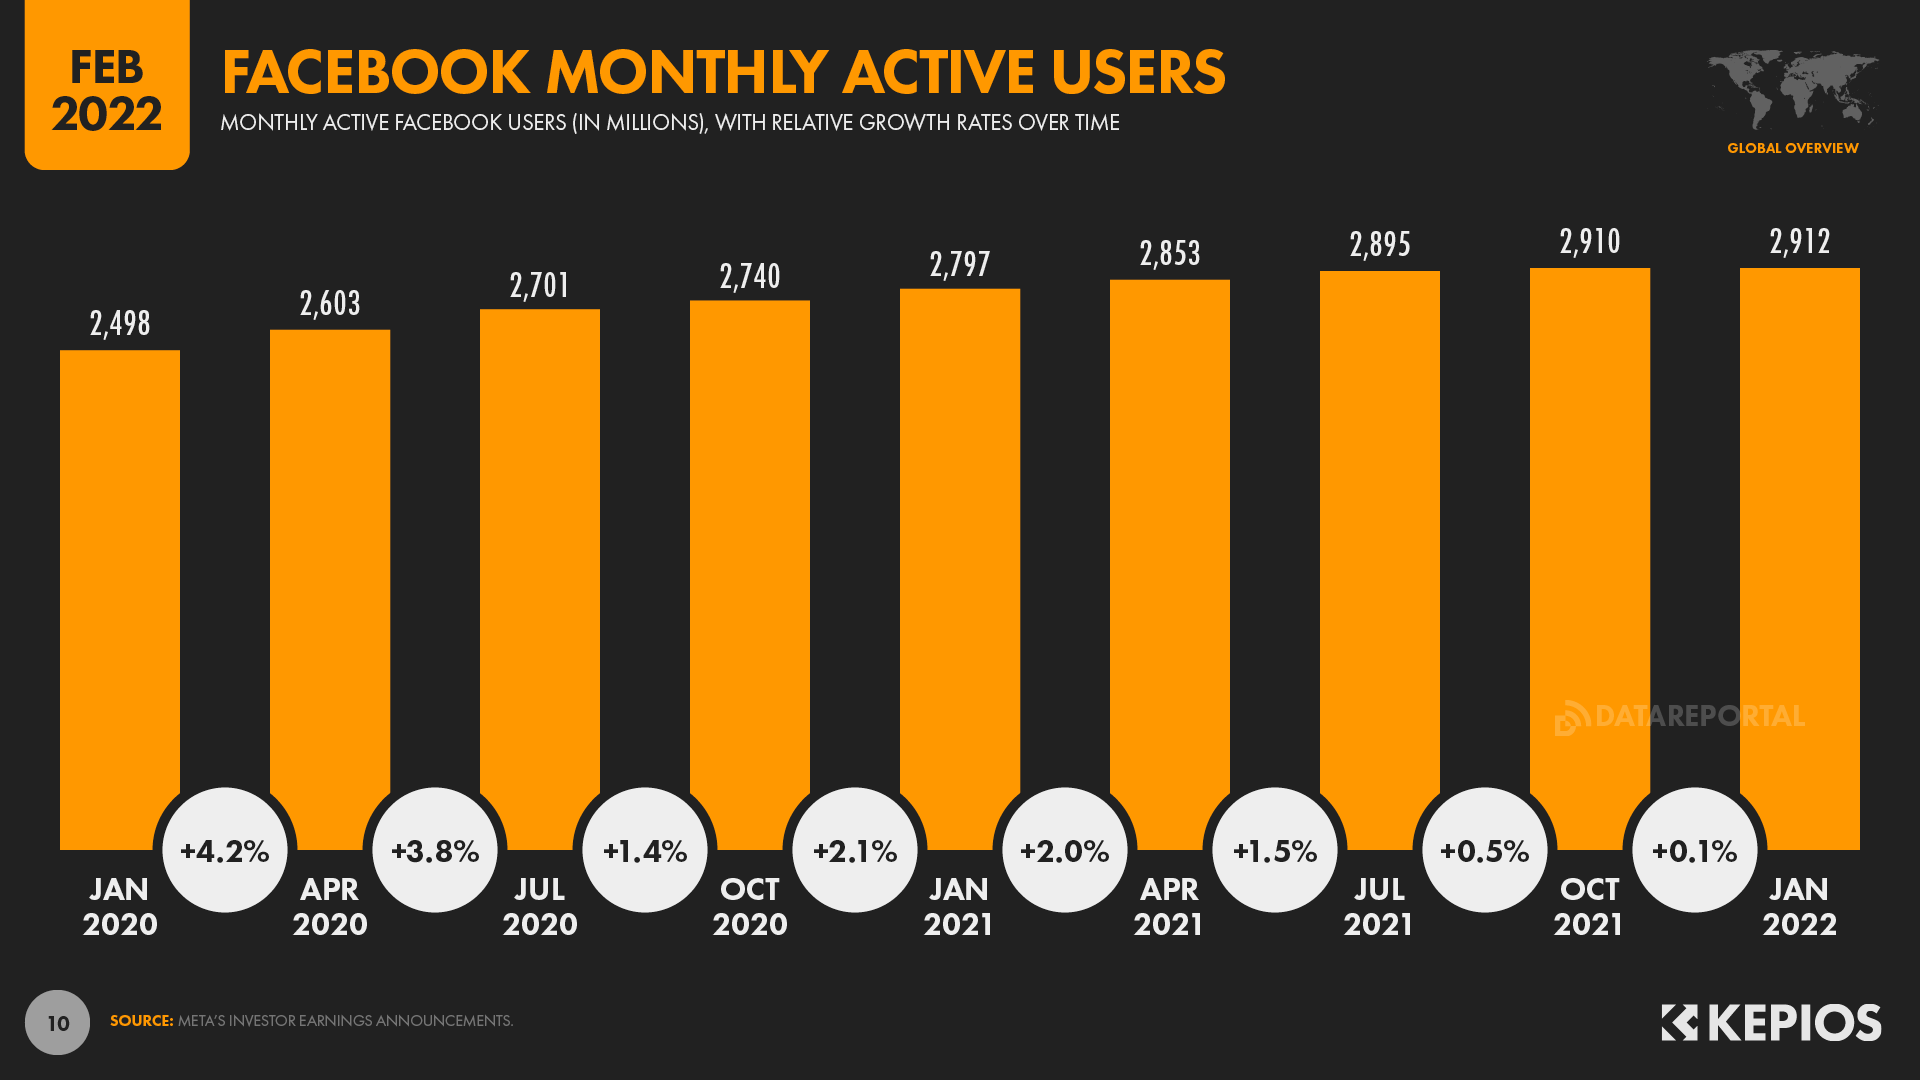
Facebook Monthly Active Users for January 2022
31. Facebook MAU amounts to 36.8% of the global population
Just imagine… You can reach 36% of the world’s population with Facebook marketing.
The potential reach is slightly lower (check #33 below).
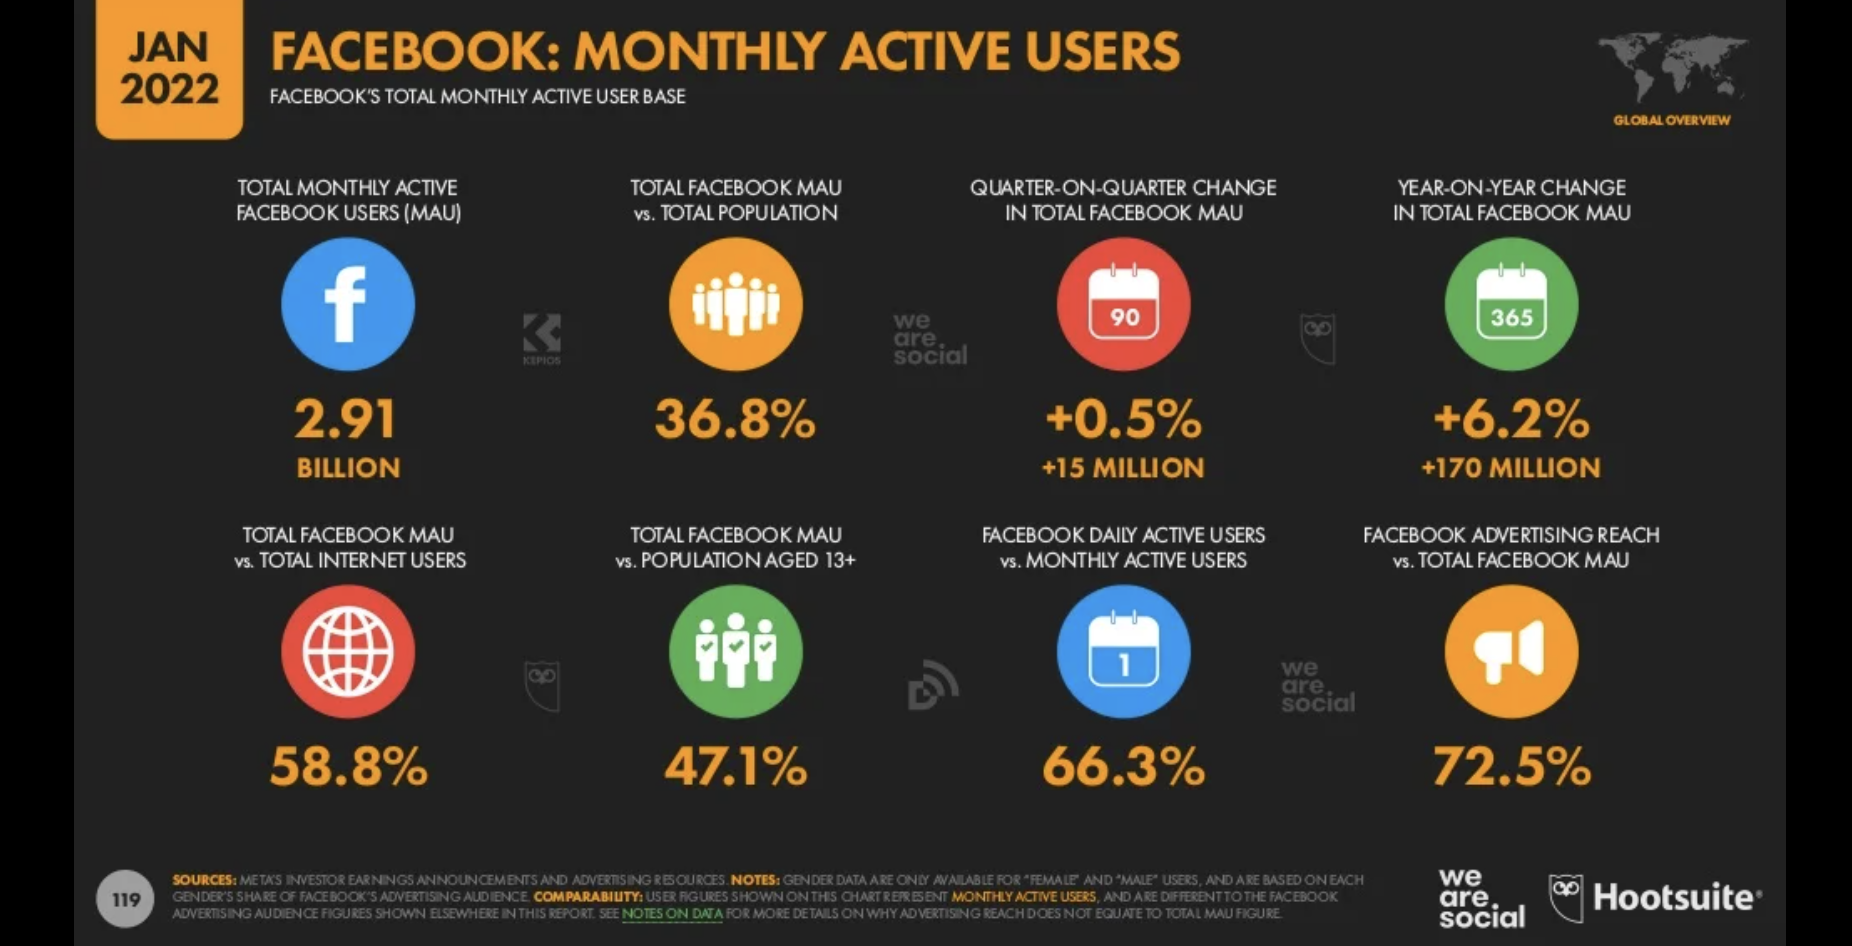
Facebook MAU makes up 36.8% of the global population – Source
32. Facebook MAU is 47.1% of all population aged 13+
According to the 2022 Facebook marketing statistics by WeAreSocial, Facebook’s monthly active user count amounts to 47.1% of the world’s population aged over 13.
33. Facebook ads reach 26.7% of the global population
Ads don’t reach every Facebook user. WeAreSocial reports that ads currently reach around 26.7% of the world’s population.
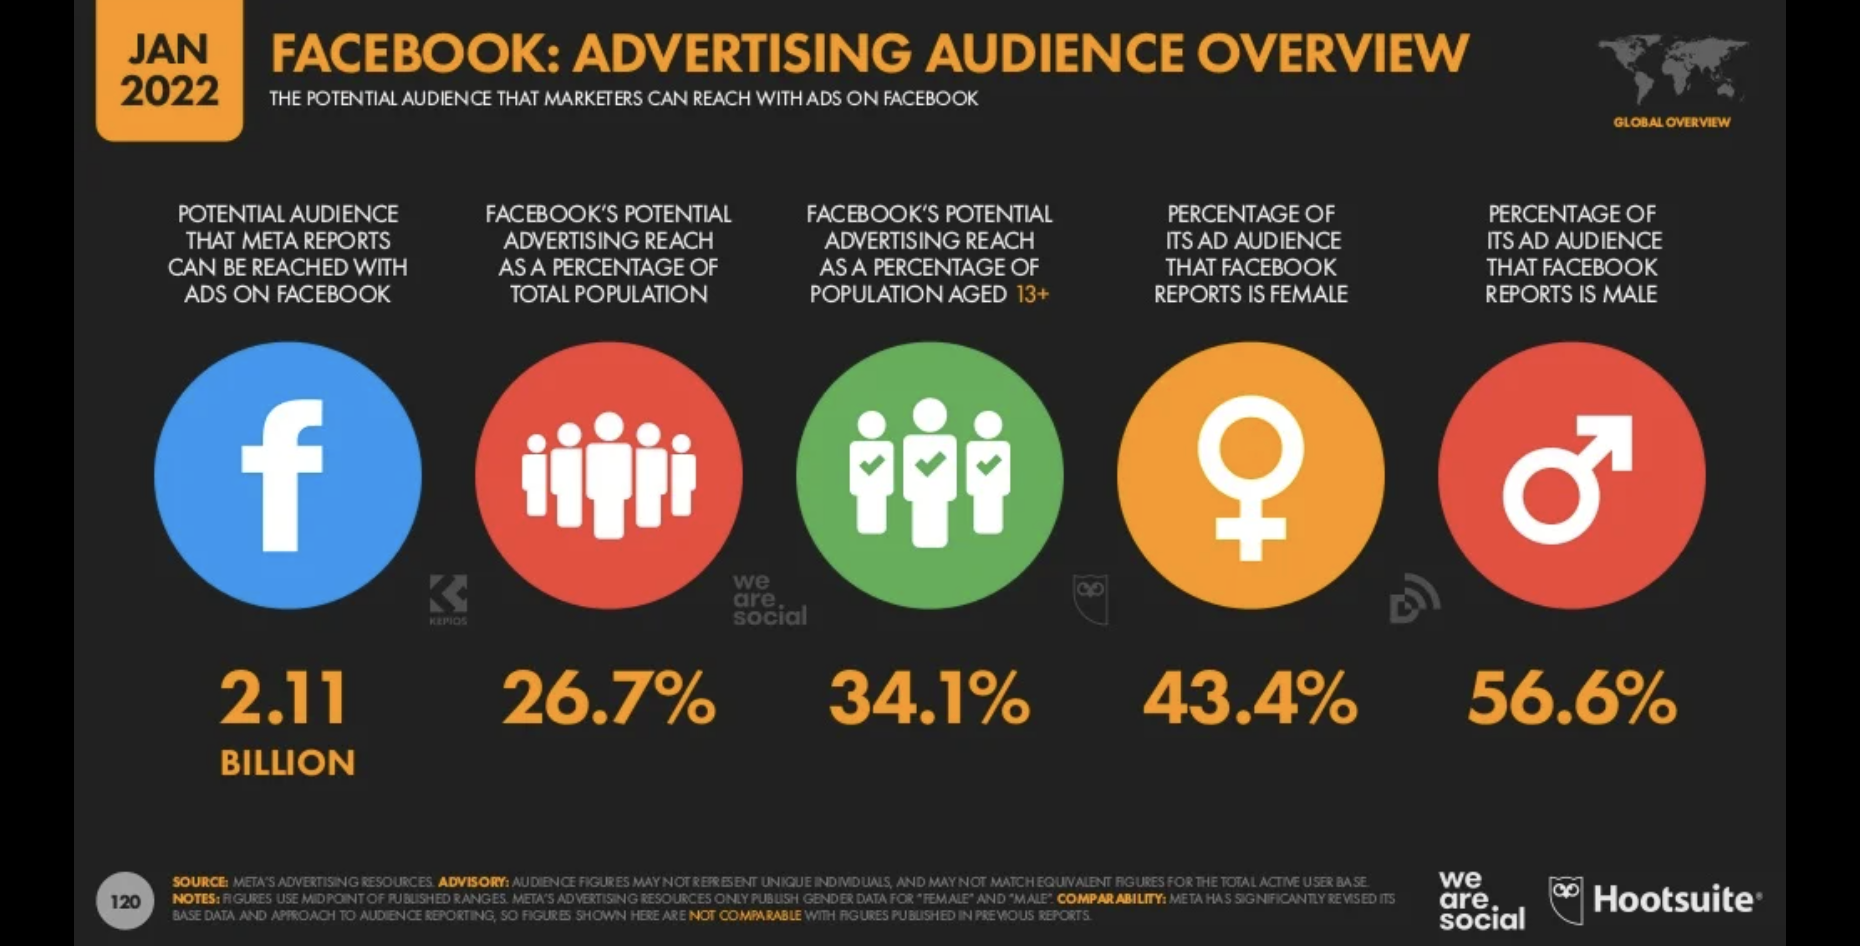
Facebook ads reach 26.7% of the global population – Source
34. The US makes up around 7% of Facebook’s user base
As reported by Statista, most Facebook users live in India (11%), followed by the US, Indonesia, Brazil, and Mexico.
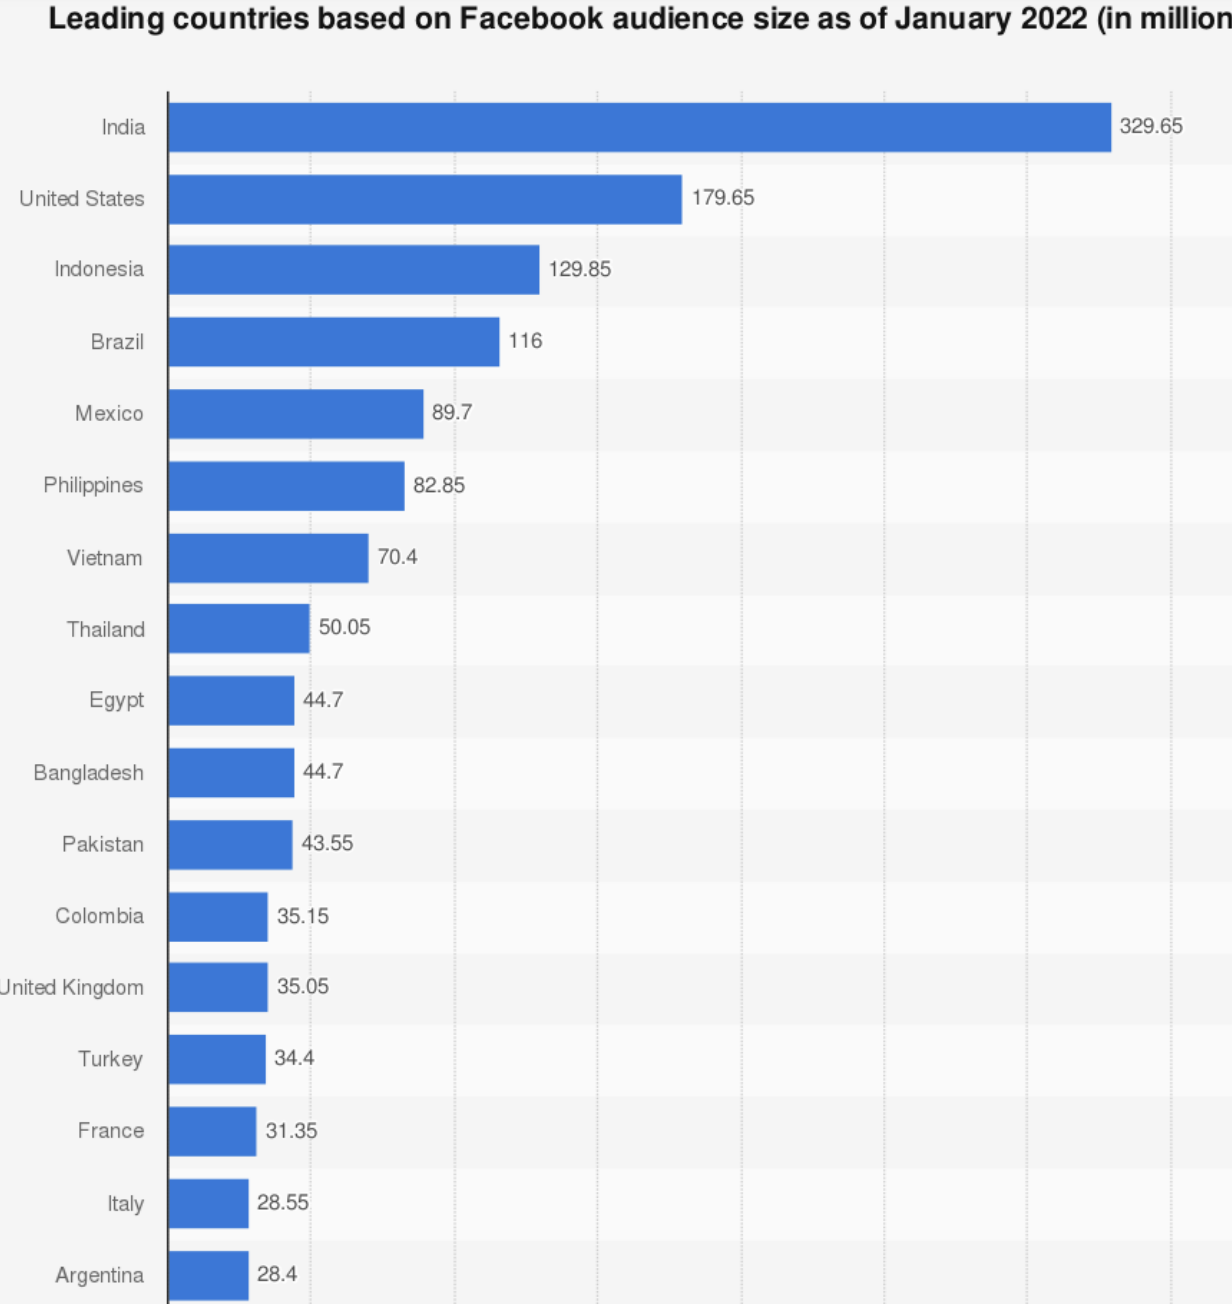
The US makes up around 7% of Facebook’s user base – Source
35. 50.7% of Facebook users are male
According to January 2022 data, 56.7% of Facebook users were male.
This breakdown is somewhat surprising; older statistics from several other resources indicate that women outnumbered men in the user breakdown.
36. 49.3% of Instagram users are female
While it might seem intuitive that Instagram has more female users than males, the 2022 data by Statista show a more even user breakdown by gender.
As of January 2022, 49.3% of Facebook users are female.

Only 49% of Instagram users are female.
37. The largest group of Facebook users is aged between 18-34
If your trying to reach millennials with your marketing message, look no further than Facebook and Instagram.
As of January 2022, 9.3 percent of Facebook’s audience were women between the ages of 18 and 24 years, while male users between the ages of 25 and 34 were the largest demographic group on the social media platform.
In 2020, 30% of Facebook’s audience was under 25.
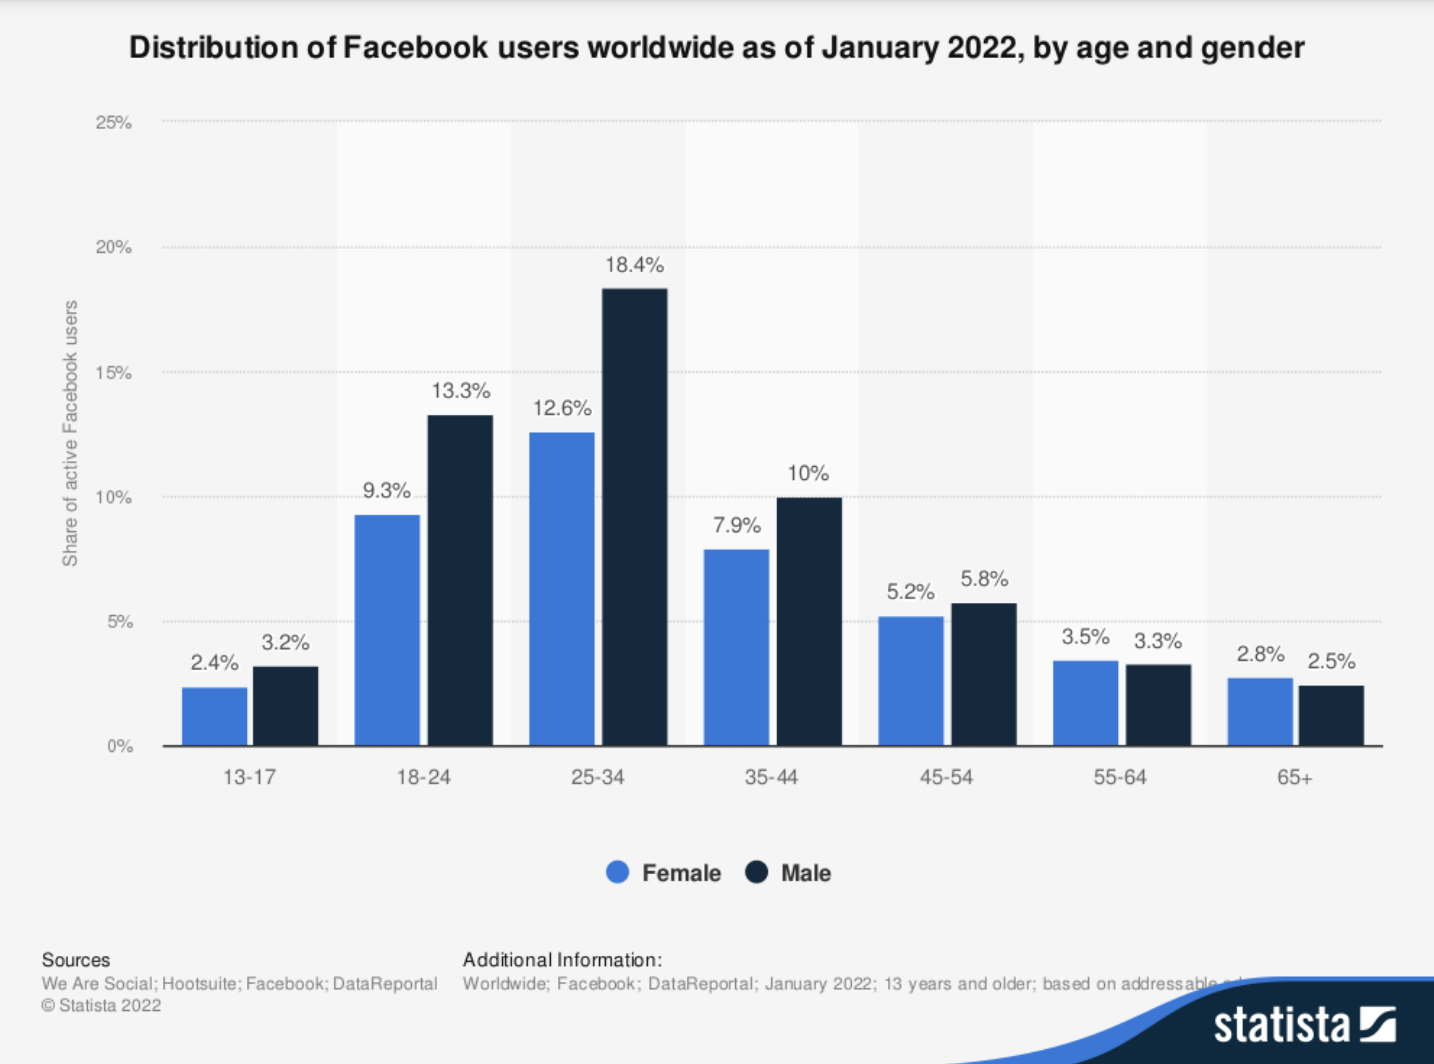
The largest % of Facebook users are age 18-34 – Source
38. 98.5% of Facebook users access the platform via mobile phone
As reported by WeAreSocial and Statista, most people – 98.5% of all users – occasionally use Facebook’s mobile apps. This includes Facebook, Messenger, WhatsApp, and Instagram.
39. In 2022, 81.8% of Facebook users only use the mobile device
We’d like to highlight that while 98.5% of all Facebook users sometimes access the platform via a mobile device, a whopping 81.8% never open the desktop website.
In other words, if you only advertise on desktop, you can reach as little as 18.2% of the total Facebook user base.
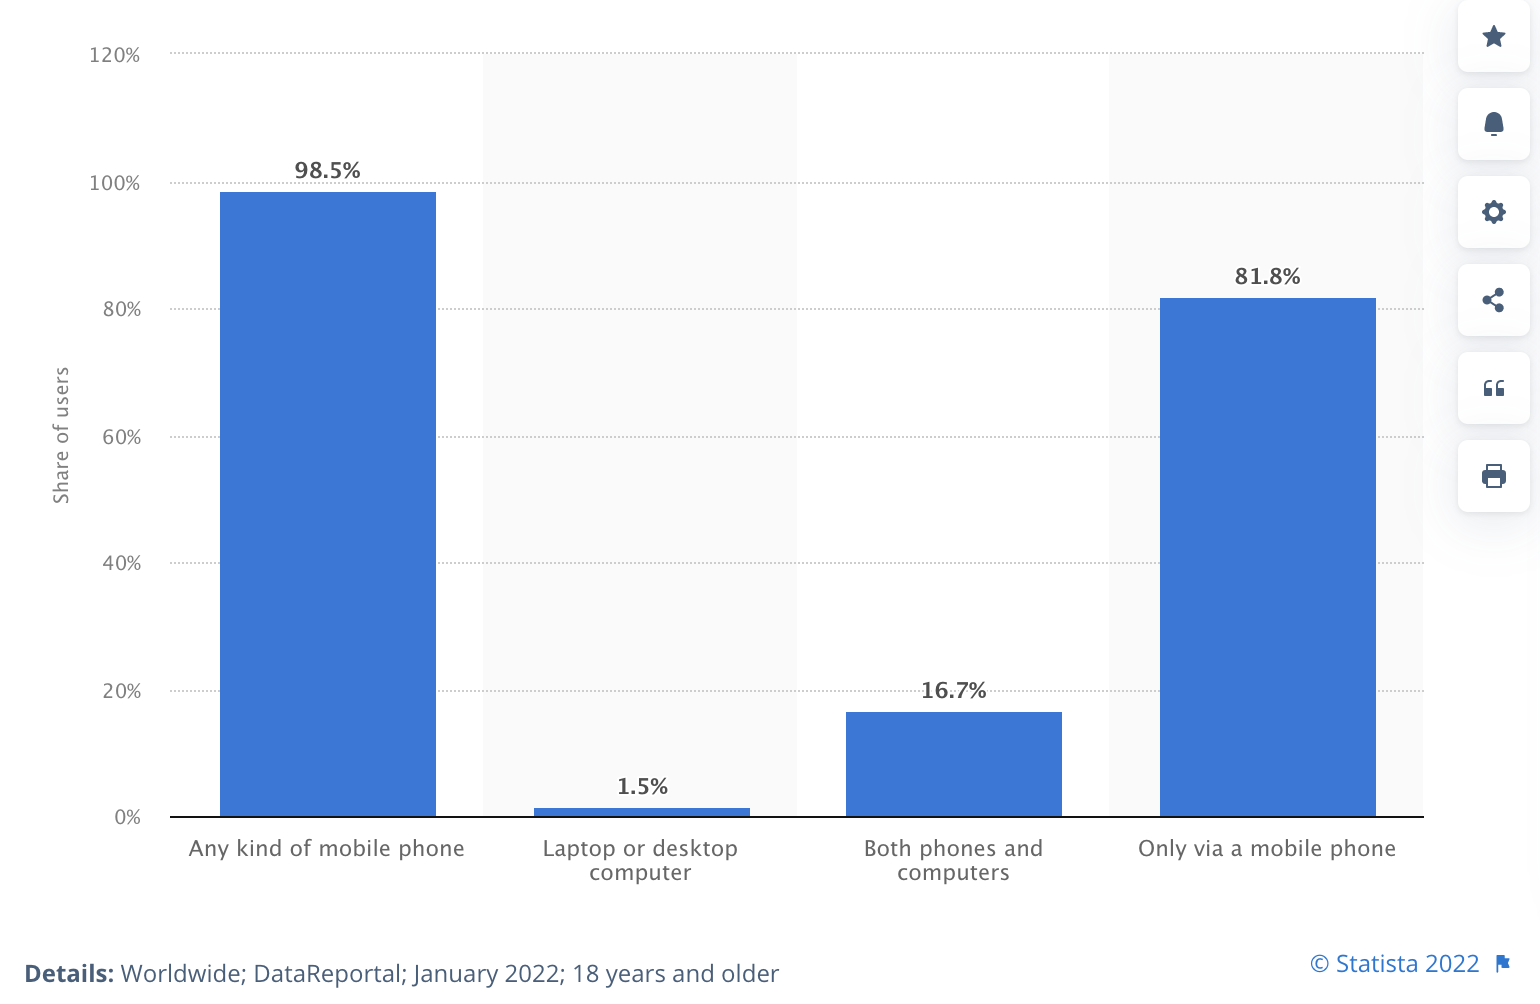
81.8% of users only use Facebook & Instagram on mobile – Source
40. Over 72% of Facebook users also use YouTube, WhatsApp, and Instagram
According to the 2022 report by Hootsuite and WeAreSocial, more than 72% of active Facebook users also browse around on YouTube, WhatsApp, and Instagram.
Knowing such cross-channel statistics can help you develop more complex Facebook retargeting strategies.
41. Instagram is used by 74.8% of Facebook users
There’s considerable overlap with Facebook and other social media platforms. However, the Meta family of apps covers most of the active social media landscape.
You may want to complement your Facebook Ads Manager ads with Google ads to reach 100% of the YouTube audience.
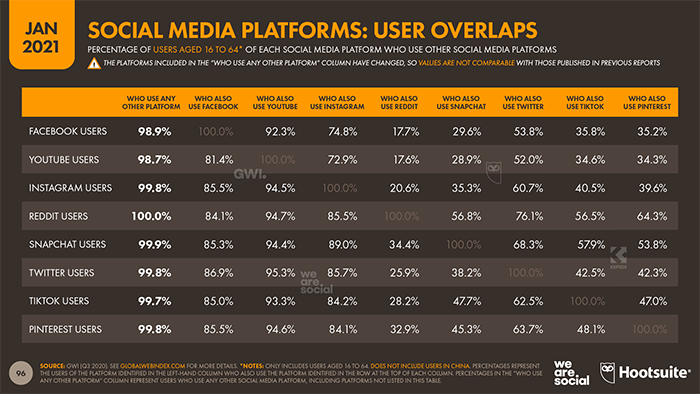
74.8% of Facebook users also use Instagram – Source
42. The Facebook app was downloaded 47 million times in the US throughout 2021
According to eMarketer, Facebook was the 4th most downloaded app in the US in 2021. TikTok, Instagram, and Snapchat led the pack.
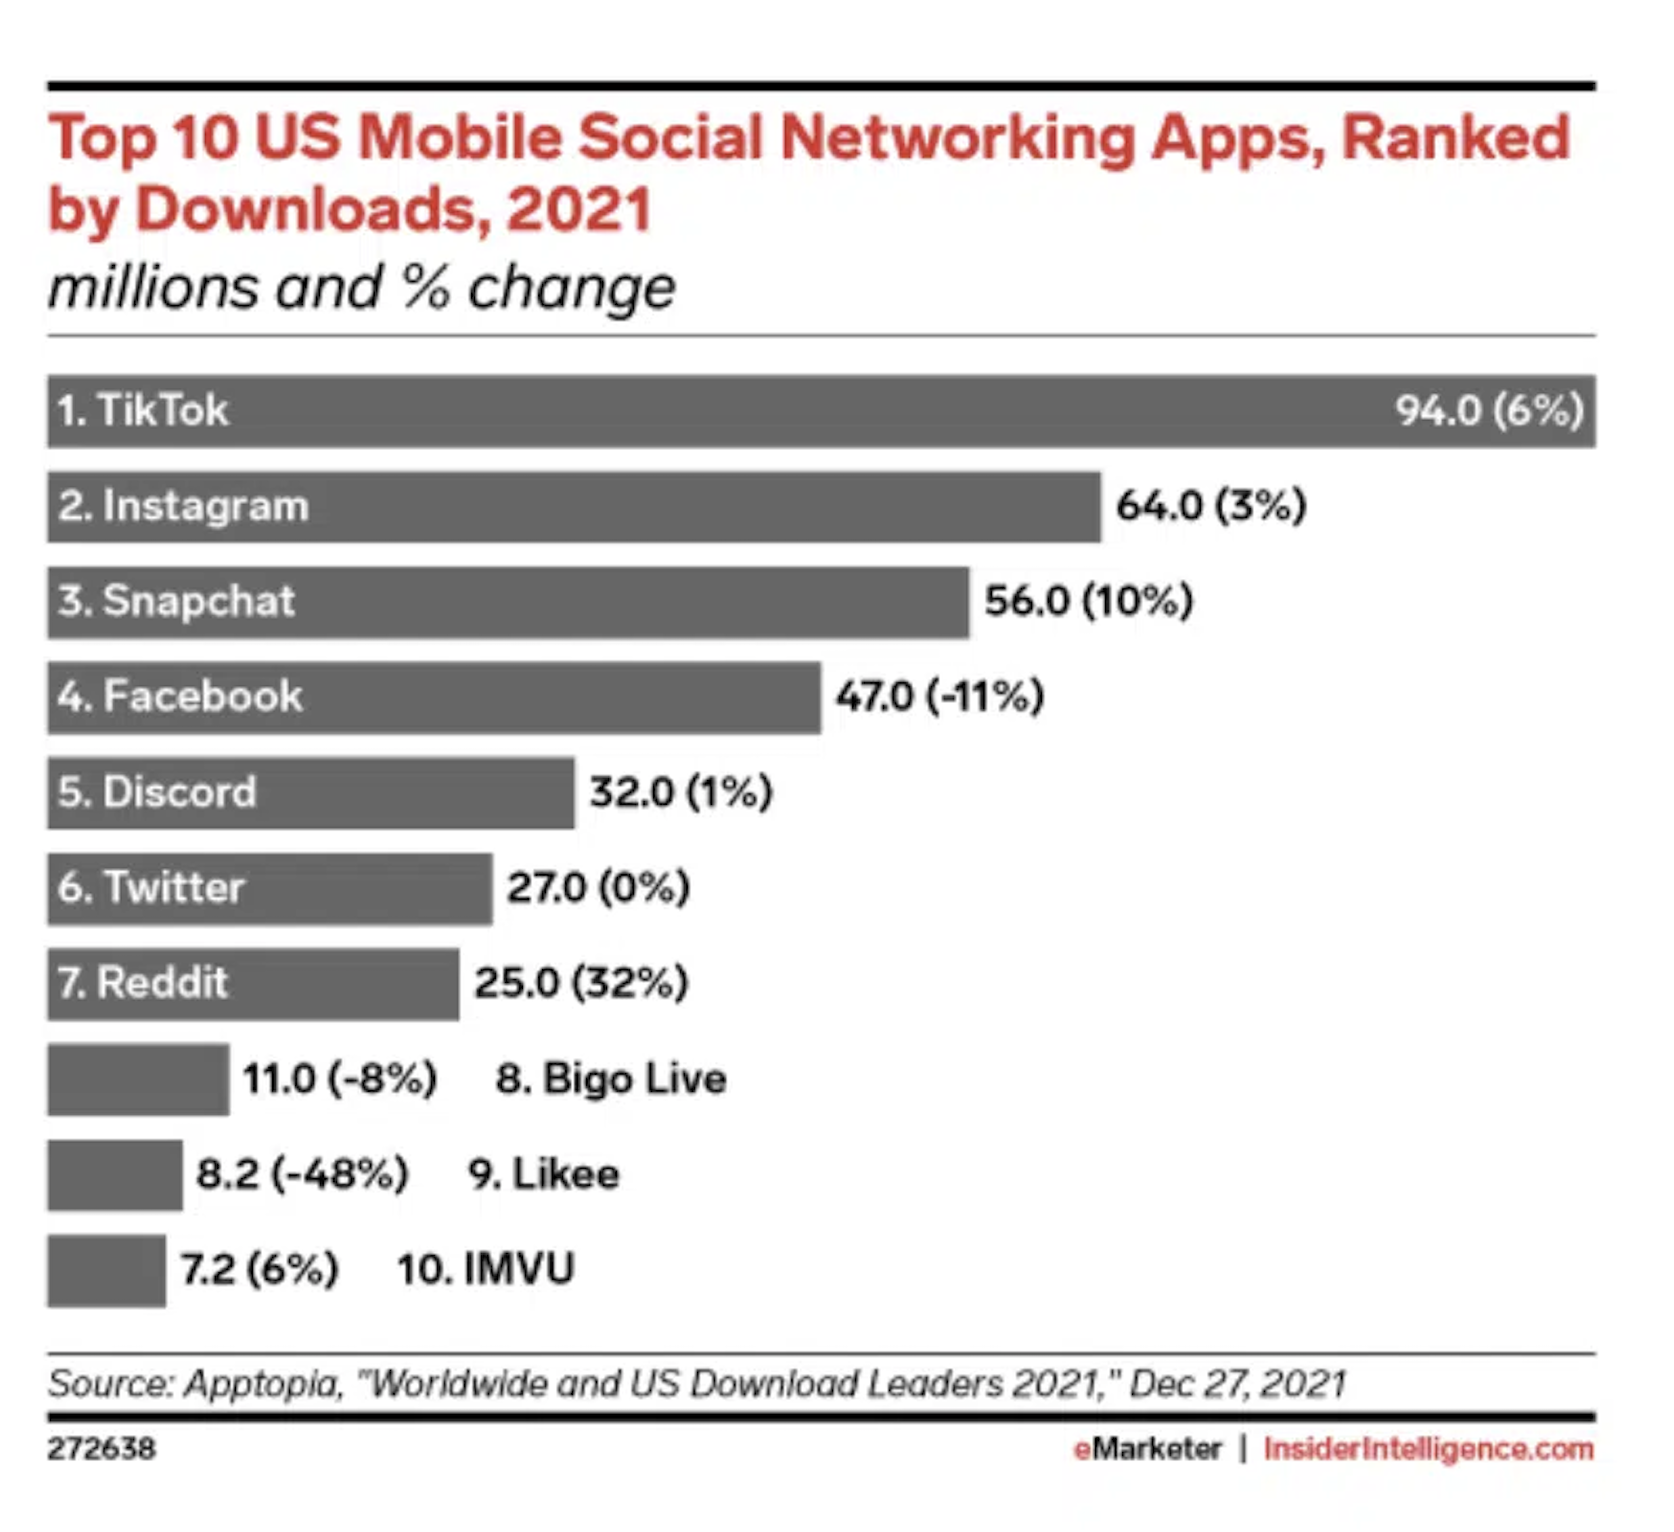
The Facebook app was downloaded 47M times in the US in 2021 – Source
43. More than 1 billion people use Facebook Marketplace
You might have noticed Marketplace among your Facebook ad placements. Marketplace is the buy-and-sell environment belonging to Meta.
Since its launch in 2016, Marketplace has grown to 1B+ users.
44. There are 250M+ stores on Facebook Shops
Since launching the Shops feature in 2020, Facebook has taken quick steps toward becoming a relevant eCommerce platform. There are now 250M+ stores on Facebook Shops.
Read more about Shops in this beginner’s guide published by Facebook.
45. 75% of online users with 75K+ annual income are on Facebook
If you want to reach an audience with high purchasing power, look no further than Facebook and Instagram.
Out of the online users with 75K+ annual income, 75% are Facebook users.
No wonder so many luxury brands – Louis Vuitton, Chanel, and Dior, to name a few – are investing heavily into their brand presence and Facebook advertising.

You can reach high-value audiences via Facebook ads.
⭐ Creative-focused Facebook Ads statistics
Marketers are reacting to frequent updates to Facebook’s core features, including new options for ad formats and creative.
Next up are the major creatives-oriented Facebook marketing stats and predictions for 2022.
46. Over 1B Stories get posted daily across Facebook apps
The Stories format continues to grow in popularity across Facebook, Instagram, and WhatsApp, and 62% of people surveyed by Facebook said they would use Stories even more in the future.
To succeed with your Facebook marketing in 2022, allocate extra resources and budget to Facebook (and Instagram) story ads.
47. Around 47% of marketers plan to use more video
With the rise of TikTok and Snapchat, video has also become more prevalent on Facebook and Instagram platforms. Around 47% of marketers surveyed plan to use more video in 2022.
The younger generation is shifting away from the Instagram Feed and mostly posting and engaging with Stories and Reels. You better catch that train fast or watch your competitors take over your fan base.

Around 47% of marketers plan to use more video – Source
48. 60% of marketers say video ads outperform static images on Facebook
We’ve seen the recent Facebook stats showing an increased interest in video formats–but why?
A Databox survey gives a pretty good picture: 59.3% of surveyed marketers saw better engagement and click-through rates with Facebook video ads than static image ad formats.
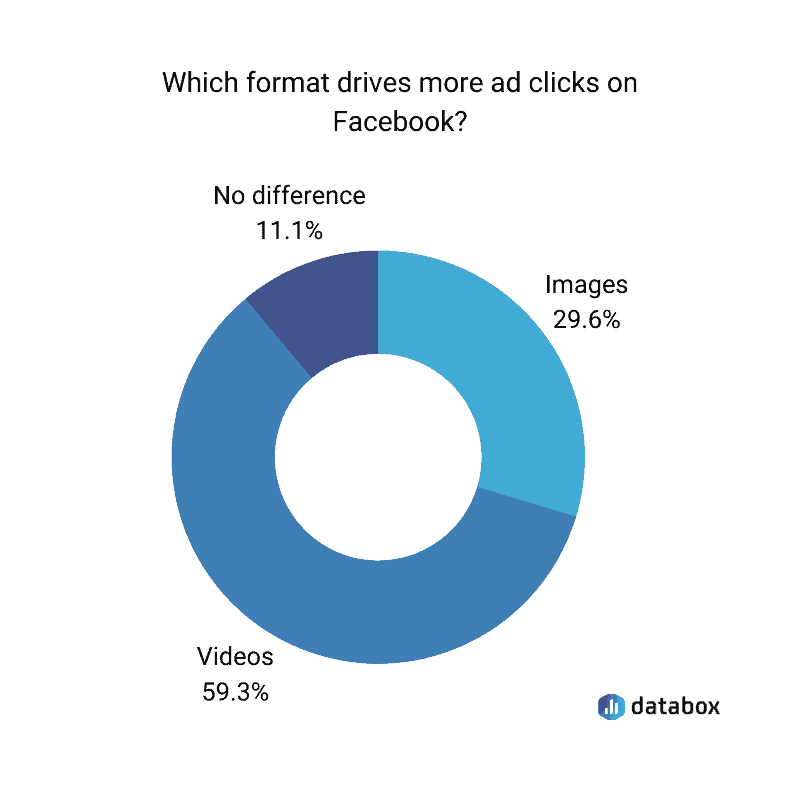
Video beats out static images for ad clicks on Facebook – Source
49. The best Facebook ad video length is 12-15 seconds
While Facebook allows advertisers to insert video ads that are 5 seconds to 10 minutes long, users prefer video content that’s 15-seconds long at maximum.

Your video ads’ 5 first seconds count the most.
50. Ad videos longer than 5min have a 40% engagement rate
The shorter your Facebook ad video, the higher the chance people will engage with it. The research conducted in 2021 by Wistia showed that video ads under 1min have the highest engagement rates.
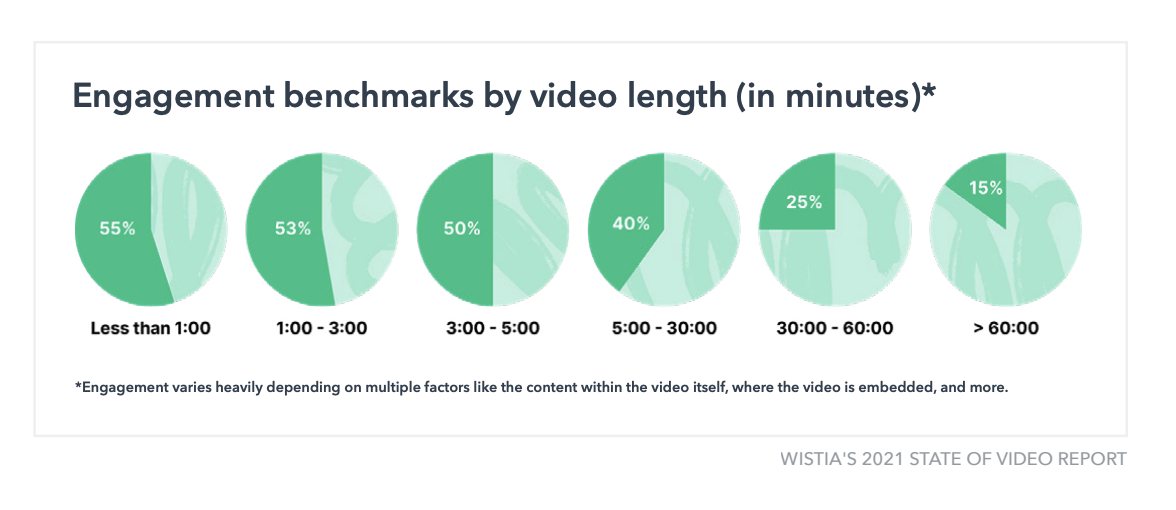
Long videos have lower engagement rates – Source
40% engagement may still seem reasonable, but remember that your stats may fall even lower, depending on the type and context of your ad, and the strength of your brand.
51. More than 50% of advertisers will invest more in Facebook brand campaigns
It’s very tempting to optimize all of your Facebook ads for the Purchase conversion.
However, it’s likely better to allocate some budget for Brand Awareness campaigns (especially those featuring video ads).
Advertising across your marketing funnel often lowers the CPC and other costs in the long run.
The social media advertisers surveyed by Smartly.io agree–as many as 54% of the respondents said they will allocate more of their ad spend to branding campaigns.
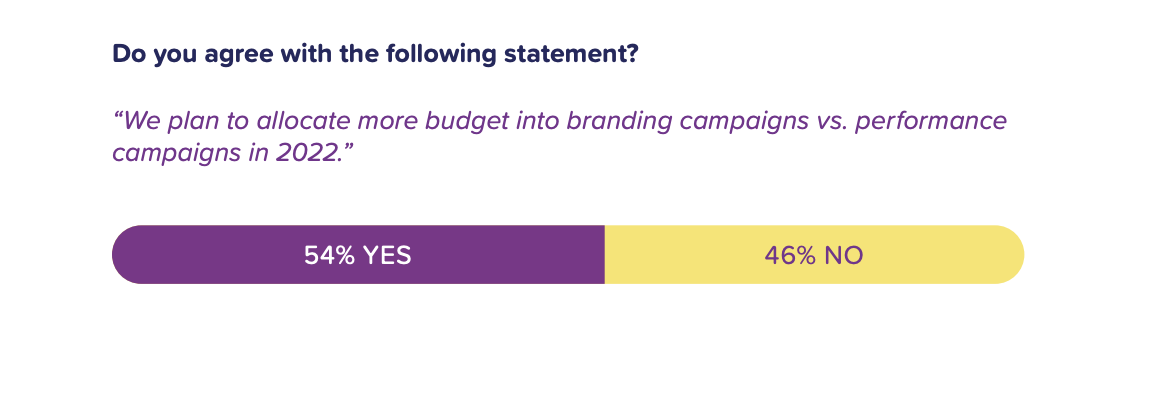
54% of advertisers will increase their brand spend – Source
How’s your advertising funnel look? Consider spending more budget on branding campaigns instead of performance campaigns in 2022.
52. More than 60% of Facebook users visit a local business page weekly
According to Facebook, more than ⅔ of its users visit a Facebook business page every week.
Keep your brand’s Facebook page up to date and publish posts regularly so that people know the page is active and trustworthy.
53. 31% of Americans get their news from Facebook regularly
While the US population looking to Facebook for daily news has declined from 36% in 2020, it is still well higher than any other social network.
In 2021, 31% of Americans got their news from Facebook regularly.
This is a good reminder to keep posting about your company updates and new products on Facebook (and Instagram) and promoting these to increase your news’ reach in 2022.
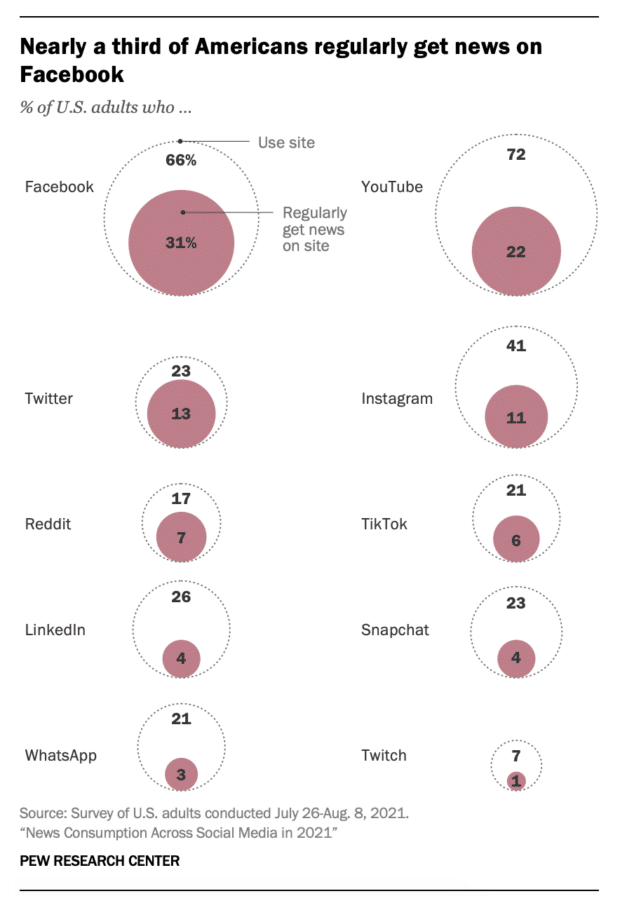
31% of Americans get their news from Facebook regularly – Source
54. The increase in Facebook ad cost is worrying 34% of marketers
34% percent of social media marketers surveyed by Smartly.io raised concerns about the increasing advertising costs.
According to the Facebook ad price statistics revealed in point #55 of the article, they have every right to be worried.
However, this doesn’t mean that marketers will stop advertising on Facebook and Instagram. They will adapt their strategies and go video-first to keep their ROAS at the same levels.
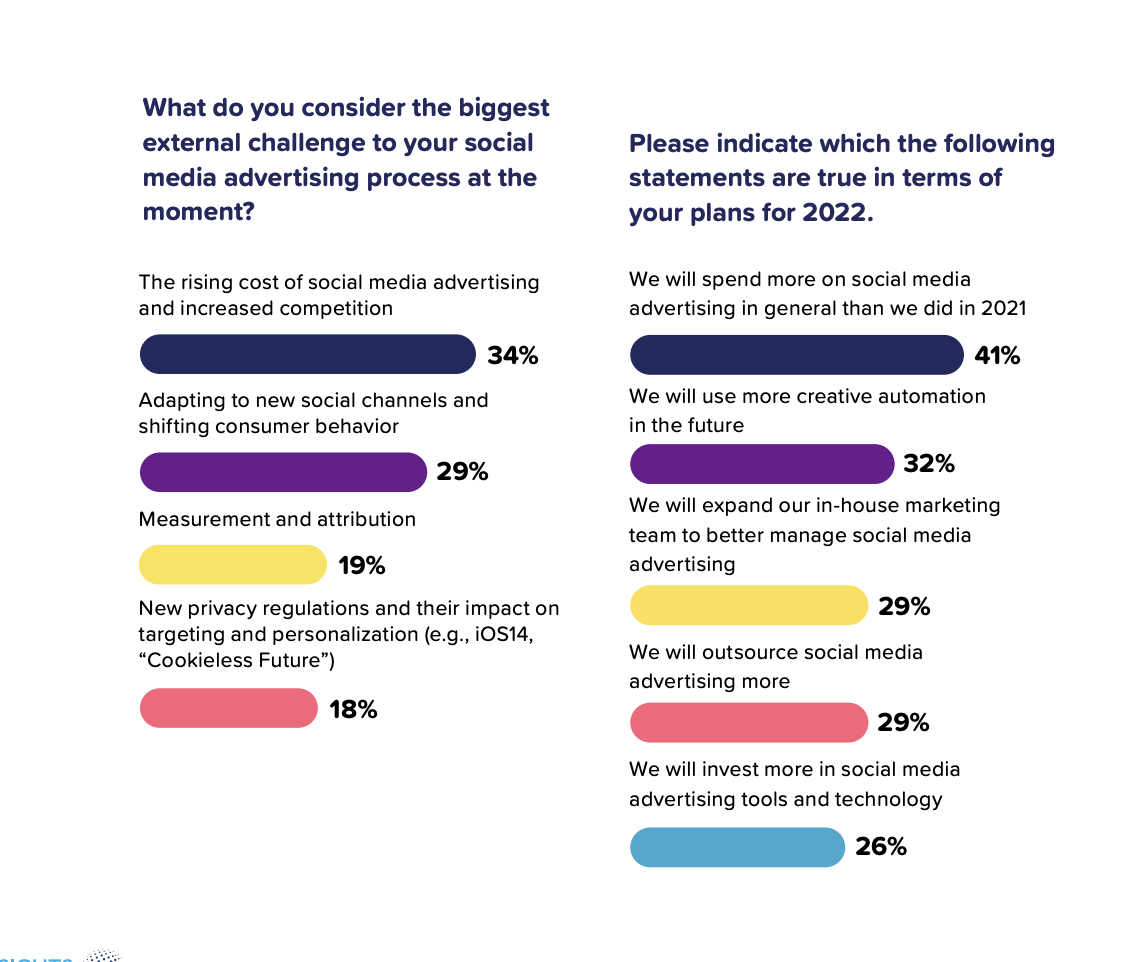
Higher ad costs are the biggest worry for marketers – Source
55. Facebook expects its revenue to grow by 3-11% in Q1 2022
Facebook has told its investors that it expects the revenue to grow by 3-11% in Q1 2022. This will come from increasing ad impressions and price per ad.
It looks like advertisers have braced themselves for the inflation and are willing to increase their investment.
eMarketer predicts that the US ad revenue will top $58.1 billion in 2022, led by a 15.5% increase from 2021.
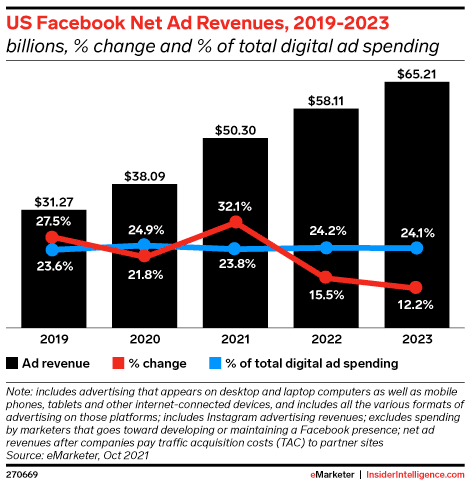
Facebook ad spend in the US is predicted to grow in 2022 – Source
⭐ Facebook ad forecasts for 2022 & 2023
Where is Facebook advertising headed in 2022?
In the last few years, marketers have needed to adapt their approach to advertising on Facebook.
Here are a few elements we expect will keep driving change on the social media platform:
Continued Reactions to The iOS 14 Update
The iOS 14 update is still a huge hurdle for many brands running Facebook Ads.
According to a report by Kantar, the Apple privacy update was a wake-up call.
Now, 81% of advertisers want their brands to rely on third-party and first-party data to remove ad targeting blind spots.
We expect this Facebook ads trend to continue throughout the year into 2023. Instead of complete reliance on official updates to Facebook’s conversion tracking, brands will invest in internal data collection methods.
Unexpected COVID-19 Impact
And what about Covid19? For one, the pandemic forced most advertising budgets to digital channels.
Unexpectedly, this includes health brands and Big Pharma companies especially.
In the first three quarters of 2021, GlaxoSmithKline invested $123.9M million in digital ads — and 42% of this went to Facebook. The brand more than tripled its Facebook digital ad spend since January 2021.
Other brands marketing to similar audiences should take note.
Facebook and TikTok Face-off
Facebook, now named Meta, keeps adding new features and apps to its platform. And that’s no coincidence.
To grow and compete with TikTok and other relevant competitors, Facebook will likely continue testing ad-ons to its core feed.
This will also mean new ad placements and different ad formats – both static and video – for reaching your audience.
Make sure the designers building your ad creative are up to the task.
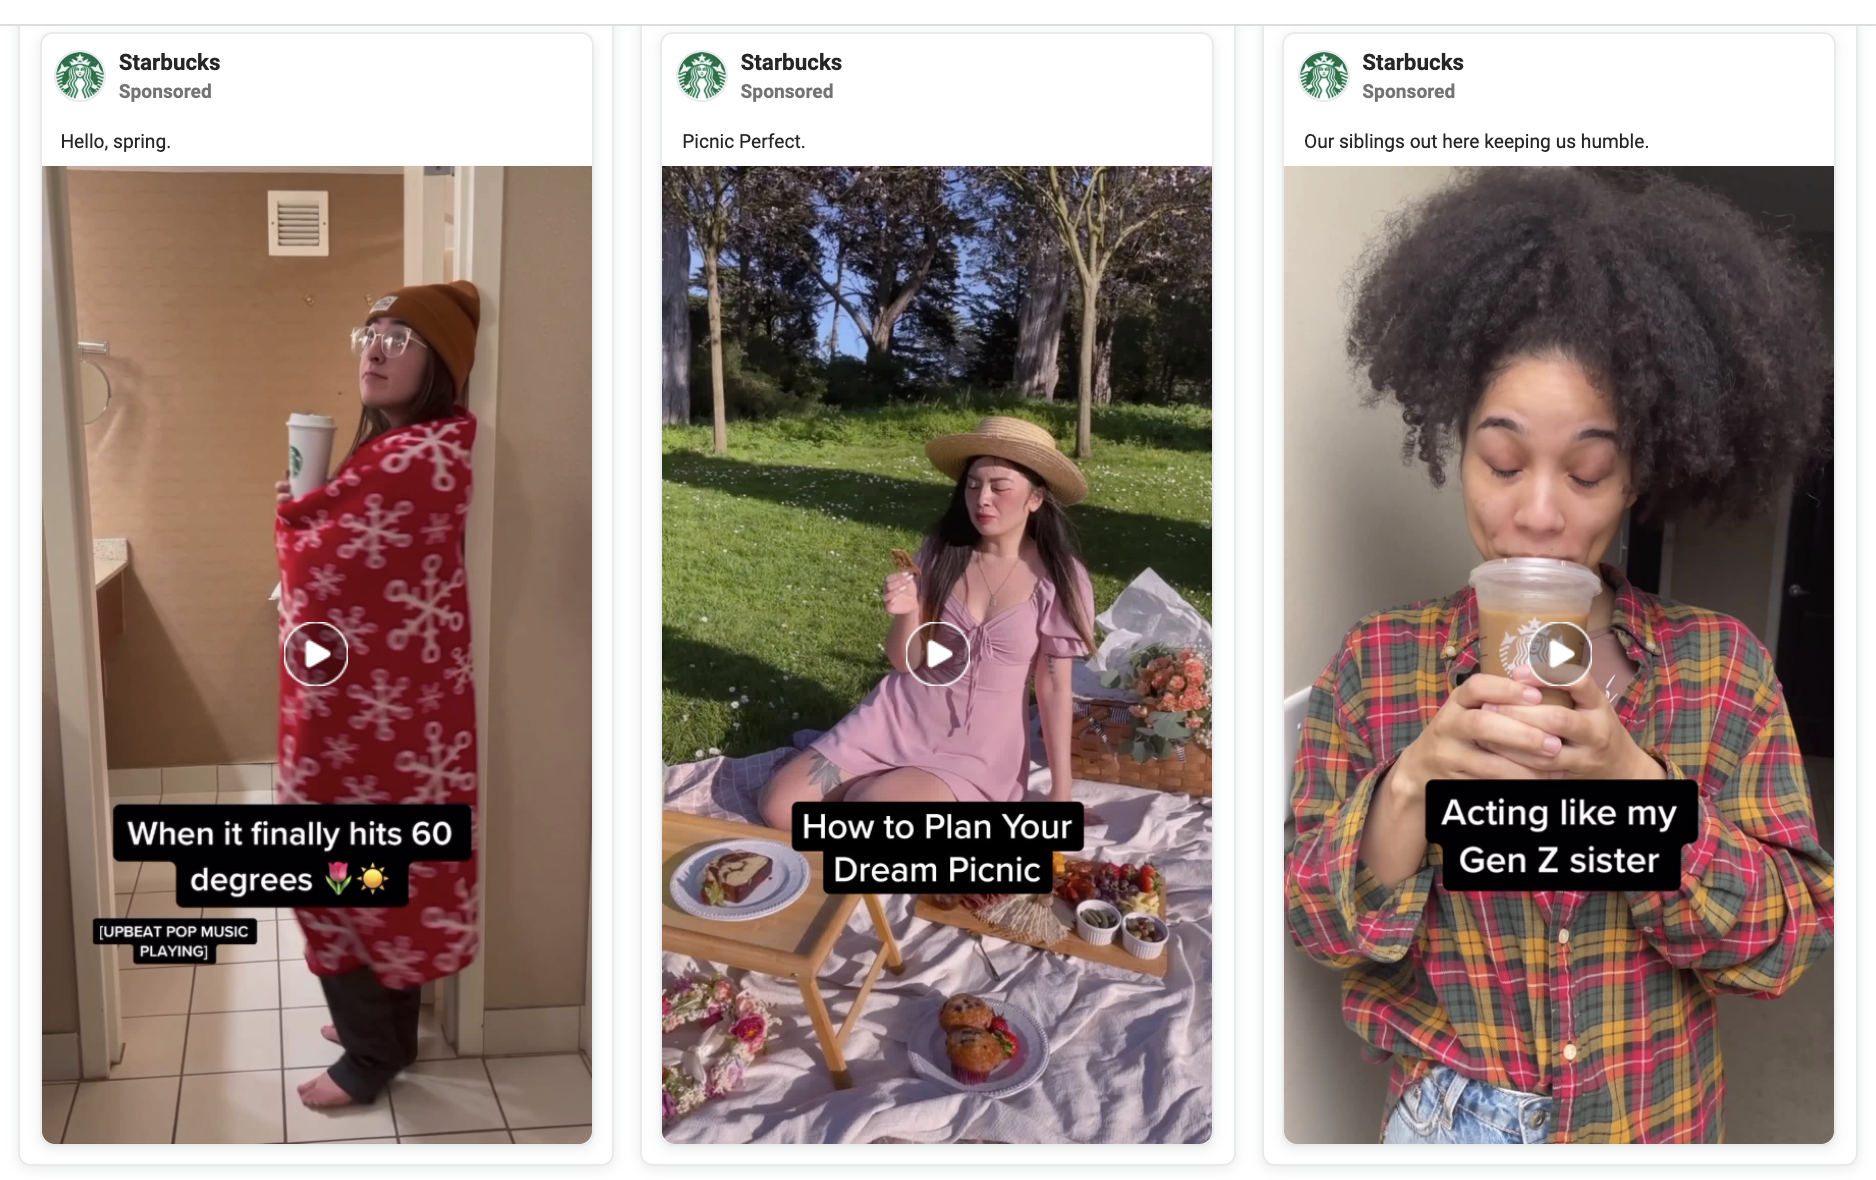
Brands are reimagining their Facebook ad creatives.
Escalating Competition…and Ad Costs
With its 2.93 billion monthly active users, Facebook is the largest social media platform in the world.
But as you saw earlier, the price of running ads on the platform is rapidly growing, too.
Another 20% increase in advertising costs might turn Facebook into an unreachable channel for many smaller advertisers.
To keep your Facebook ad costs down, see this guide.
Note: also look to conversion rate optimization to make sure you’re getting the most from your paid marketing traffic.
⭐ Facebook ad stats from 2021 and earlier
If you’re looking for more Facebook marketing statistics, we have collected 20 extra findings listed in Backlino and HubSpot blogs. Please be aware that this data might have changed since.
56. Facebook is used daily by 70% of adults in the US.
57. Over 1.8 billion people use Groups every month.
58. In 2019, 15% of Facebook users used the platform to shop for products.
59. As many as 93% of businesses are active on Facebook.
60. Over 200 million businesses are using Facebook’s apps and free tools.
61. Facebook Messenger is used by 3 billion people monthly.
62. People engage in 20 billion Facebook messages with businesses every month.
63. eCommerce stores that pair an abandoned cart chatbot with Facebook Messenger may see up to a 7-25% increase in revenue.
64. On average, 35.7% of posts published by Facebook pages are images.
65. Facebook link posts receive a 73% lower engagement than video posts.
66. Facebook Stories (not including Instagram Stories) have 500 million daily viewers.
67. 35% of marketers have reported successful influencer campaigns on Facebook.
68. In 2020, the Facebook pages with over 100k followers published 17.6% of all the videos on the platform.
69. Tests conducted by Facebook found that adding captions to video ads boosted the view time by an average of 12%.
70. Facebook’s research has shown that 80% of users react negatively to videos that auto-play with sound.
71. More than 50% of Facebook’s video advertising revenue comes from mobile-first videos.
72. Videos between 2 and 5 minutes receive higher engagement but poorer results (ROI).
73. As many as 62% of users report being more interested in a product after seeing it in a Facebook video.
74. Facebook is the 2nd most popular video platform after Google (and YouTube).
75. On average, a Facebook user clicks on 8 ads each month.
There you go–75 Facebook Ads statistics for benchmarking results in 2022.
Are you ready to grow together with Facebook? We certainly are! Get in touch if you’d like to collaborate with us on your digital ad strategy.

Luke Heinecke
Founder/CEO
Luke is in love with all things digital marketing. He’s obsessed with PPC, landing page design, and conversion rate optimization. Luke claims he “doesn’t even lift,” but he looks more like a professional bodybuilder than a PPC nerd. He says all he needs is a pair of glasses to fix that. We’ll let you be the judge.
Leave us a comment.
Subscribe to our blog
Subscribe to our blog
Get weekly PPC & CRO advice sent straight to your inbox.