Google Ads Reports are a bit of a hidden Wonderland in the PPC marketing world. And it’s easy to see why there’s so little information on it. Google includes almost all the relevant information that you’d make a report out of in one tab or another of your Ads Dashboard.
So then you’re asking, why would I use Google’s Reports?
This is the main question we’ll cover in this guide to Google Ads Reports, followed by a step-by-step walkthrough of how to create them yourself. Don’t forget to snag our 10 essential report types at the end!
Why Use Google Ads Reports?
1. Bonus Data & Views in Google Ads Reports
First, Google Ads Reports does have information that you can’t see in the dashboard. Just about any information you want to see in regards to your account, Google has tracked it and can present it to you in a neat report.
Secondly, Google Ads Reports allows you to compare stats right next to each other. Want to check your Geolocation data against your Day & Hour data? You got it. Instead of trying to guesstimate one tab’s information against another, Google makes it easy to plug and play all the data you want to without switching screens.
2. Eliminate the Need for Messy Spreadsheets
I personally love this one. Google allows you to make multiple types of reports, so you don’t have to kill your eyes on spreadsheet formatted reports.

You have a nice selection — tables, line charts, bar charts, pie charts, or scatter charts.
3. Scheduled Reporting
Busy? Yes, me too. That’s why I use scheduled reporting to automatically send my reports, so I don’t have to manually go into the system every time I manage an account. You can schedule reports to be sent to yourself or other users on your Google Ads account at a specified recurring date. The information you want express delivered to your inbox? Plus, look at all these options.

4. Complete View of Your Account
Siloed, scattered data is a big challenge for digital businesses.
This is one reason Google Reports is great. It keeps all the data from your Google Ads account in one place, lending you an accurate 50-foot-view of notable trends and data that just aren’t visible on your dashboard.
Your Google Ads dashboard lets you see a plethora of number stats, but when it comes to keyword and search term data, comparing campaigns and ad groups against each other, and other information, dashboards just don’t have it.
Lastly, since your data is in one spot, your reports stay a lot cleaner. Reporting and storytelling is a huge task to manage on top of running and optimizing your account, so this takes quite a bit of work off your plate.

How to Set Up Google Ads Reports
There are two ways to create your Reports in Google Ads Manager.
The first way is to select the Reports option under the Reports dropdown. The second is to create reports using Predefined reports (Dimensions) option in that same Reports tab. Google has created tons of predefined reports that make it easy to click and create a report in seconds. They have over 40 reports that you can create in literally less than a second.

I’ll go over the Dimensions Tab reports first in the next section, and then follow up with our favorite personalized reports, which can be created in this way:
- Reports & Reports Again
- Custom
- Select What Kind of Graph You’d Like (This Can Be Changed At Any Time)
- Drag & Drop Your Information Into Rows And Columns (There’s A Nifty Search Bar If You’d Like To Search For Specific Stats)

Our Favorite Predefined Reports (Dimensions)
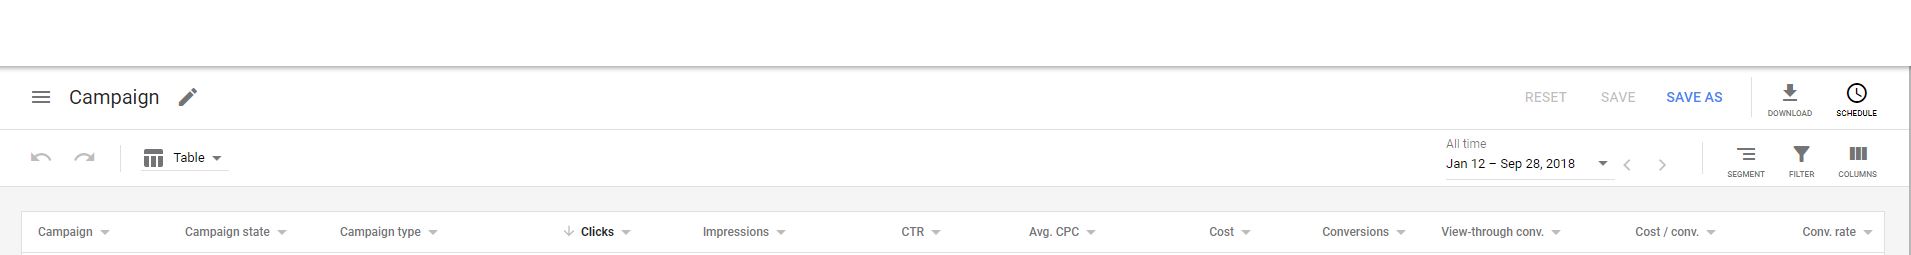
Google Ads Report #1: Basic > Campaign
For quick info and comparing campaign against campaign, this will be your go-to. Here, Google will display all of your campaigns in a column with your ducks…I mean…data lined up in a row. Here you can sort the columns to see which campaigns have the best metrics and are really performing well.
This is really where you can see that 50-foot view of your account. You can compare side by side data that may surprise you. For instance, you may find that while one campaign will pop up at the top for most conversions, another campaign may have a better conversion rate or a lower cost per acquisition. This information helps you know where your money is being spent the most effectively.
Here are the columns that Google shows you when you quickly create the Campaign Report. Remember you can modify the columns the same way that you modify them in your dashboard:
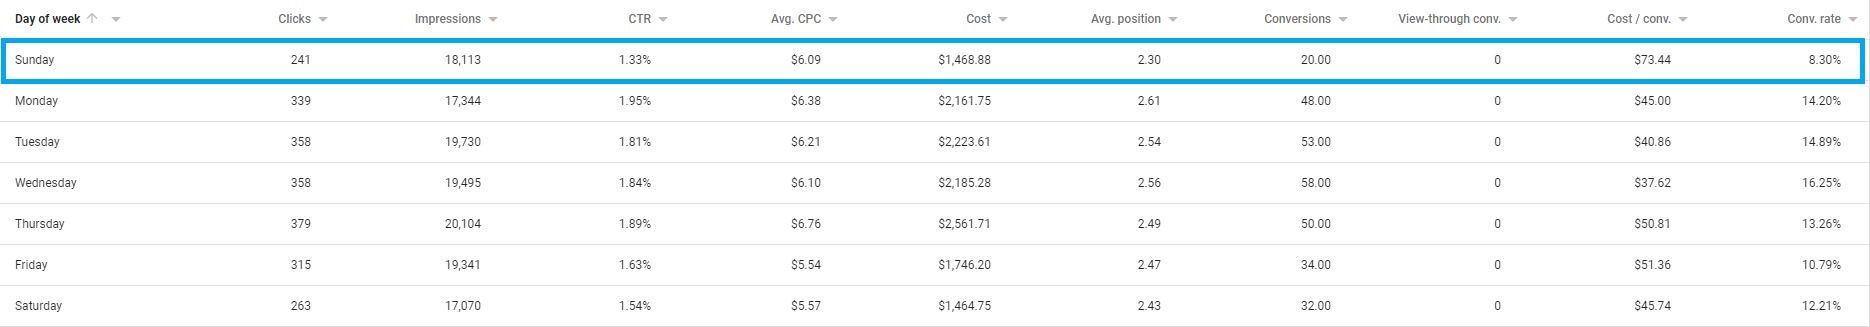
Google Ads Report #2: Time > Day of Week
For an account overview and mile-high look at your profitable days, pop open the Day of Week Report. Sure, you can view information like this in your Dashboard on a campaign by campaign level or in all campaigns, but this report neatly sums up your entire account’s day information. Account data, no campaign data, and no fluff.
Taking a look at this one real quick, you can see that Sunday has the least amount of conversions, the highest cost/conversion, and the lowest conversion rate. Perhaps we could save some money on Sundays?
Google Ads Report #3: Extensions
If you’re not already using extensions on your ads, then go back and create them right now. Extensions are the best thing for your Google Ads because they allow you to give your potential customer what they want – more information. Seriously, they’re great.
And because they’re such a benefit to your ads, you’ll want to keep an eye on how they’re doing and what’s working for you.
From the Extensions drop-down, you can select any of the extensions that you’re currently using and see how well specific ones are boosting your ads, where they’re ranking in the average position across the entire account, and more:
And one of the best parts of the Extensions Report? Simply by clicking on the Filter, you can add all the other extensions to the report to compare your types against each other. But that’s a customizable report, which brings us to the next part.
Our Favorite Customized Google Ads Reports
The Predefined Reports Google Ads Reports offers are pretty straightforward, but what about custom reports?
Next up, I’ll share our favorite customized reports and how to use Google Ads customized reporting.
Google Ads Report #4: Demographics (Age & Gender)
As a disclaimer, your top result for any metric that you place on the age and gender report will be undetermined and undetermined. That’s simply because everyone has the option of listing their age and gender in their Google account, and the number of people who choose not to list one or the other will consistently be higher than those who are listing their personal information. That doesn’t mean that all hope is lost, though.
For this client, we want to know who is spending the most money on our product:

As mentioned, undetermined and undetermined ranks at the top by a long shot. However, right below, we see that the youngest available age group, 18-24 is spending the most money. The genders are pretty close, which is what we’d like to see.
If your product is designed for one gender or another, this is a great way to see if the marketing is hitting your target audience. It’s also a great way to start building a customer persona if you don’t have one already set up. The more personal your ads can be, the better your chance of getting the sale is.
Google Ads Report #5: Geo Report
If you’re a business that travels to meet the client, this report is the one for you. Let’s say you service a specific area in your state, and your location settings are set up to target a range of cities or a radius from your warehouses. If you have a set of trucks that are running out to perform these jobs, you may not know off the top of your head where everyone has gone over the past month.
Thankfully, Google knows where the jobs came from. Crack open a Geo Report, and you can see not only the cities where the jobs came from, but also how much those jobs cost you in marketing dollars. If there’s a city that’s just too far out of your range and you’re paying too much for their conversions, it may be time to set some bid adjustments.
Google Ads Report #6: Distance From Location Extensions
On the absolute flip side, if you have a brick and mortar that requires customers to come to you, you’ll want to build a distance from location extensions report. (Of course, this requires you to first have a location extension for your campaigns, which simply lists the address where a customer can find you.)
Once you load the report, you can see how far people are willing to travel to visit you. This is helpful if you’re a new business and start out targeting – say, 50 miles or so with your ads. You can see how far away people are converting from and if the money you’re spending to target them is worth it.
If you’re only getting a few customers at 40+ miles away, and your cost is too high for those, you can start to adjust bids or perhaps shrink your targeting radius.
Google Ads Report #7: Click Type By Device
We recommend setting this one up as a bar graph as it get a little confusing. In this graph, you’re answering the question, “What part of my ad is getting the most clicks on different devices?”
The reason why this is so important is because you want to know what your customers are thinking when they’re using their phone, computer, or tablet and viewing your ad. While you can’t pull a Professor X and read their minds, you can see what they’re clicking and draw some conclusions from it.
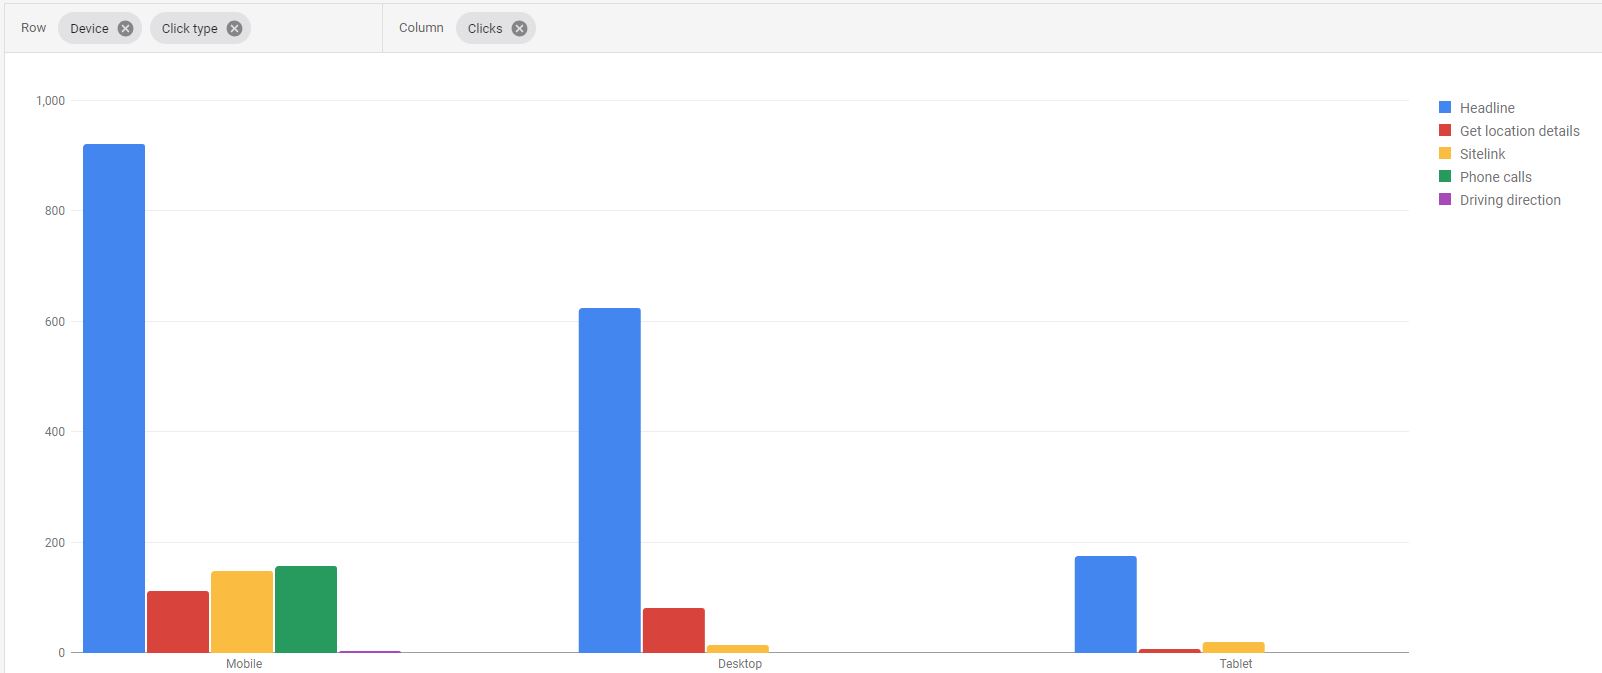
This report surprised me when I saw that mobile users were selecting the headlines of my ads over phone calls even though they were clearly on their cell phones. This led to more research and insight.
Google Ads Report #10: Quality Score
Sometimes quality score can feel like a black box of mystery, confusion, and increasing cost. One useful report that you can create is Google’s breakdown of your quality score for campaigns and ad groups. Although you can’t get this breakdown for each individual ad, applying the quality score metrics to an ad group can point you in the right direction for what’s affecting your ads.
Here are the breakdown metrics that you can measure:

A Few Google Ads Reports Tips To Always Remember
Is All Your Data Present?
When viewing a table report, Google’s default feature shows it as 50 rows. For large and well-SKAGed accounts, this may not cover the number of campaigns or data that you want to look at.
If your report looks off or you can’t find a specific bit of data you’re looking for, check the bottom and make sure your report is showing all the data you need.
Do You Have The Right Time Set Up?
Similarly to your Ads dashboard, always double check your calendar when viewing your data. There’s nothing more frustrating than analyzing your data and drawing conclusions…only to find out that you’re looking at the wrong time frame.

Don’t Forget About The Compare Feature
One of the best things about Google Ads Reports is their ability to compare a variety of stats against each other, but the compare feature doesn’t stop there. Just like your dashboard, you can compare dates against each other. Depending on how long your Google Ads have been running, you can run a comparison of a month in 2017 to a month in 2018 to compare your year by year progress. Or you can even just run a month by month comparison of whatever data makes you happy.

What reports did you see that you’d like to take a look at? Are there any must-haves that we missed? Let us know in the comments!

Evie Welborn
Account Manager
Evie is dedicated to keeping an eagle eye on her PPC and digital marketing accounts. When she’s not scouring through her accounts to make sure they’re flawless, she can be found ascending new heights in the local mountains or hiding inside the rock climbing gym when it’s too cold.
Leave us a comment.
Subscribe to our blog
Subscribe to our blog
Get weekly PPC & CRO advice sent straight to your inbox.